Unlocking Trend Direction with the Solar Wind Joy Indicator
Trading the forex market requires a clear understanding of momentum and trend direction. For traders utilizing the MetaTrader platform, custom technical indicators often provide the clarity that standard tools lack. One such tool that has gained popularity for its visual simplicity and responsiveness is the Solar Wind Joy Indicator.
Designed primarily for day traders and scalpers, this indicator transforms complex Price Action data into an easy-to-read histogram, helping traders filter out market noise and pinpoint high-probability entry and exit points.
What is the Solar Wind Joy Indicator?
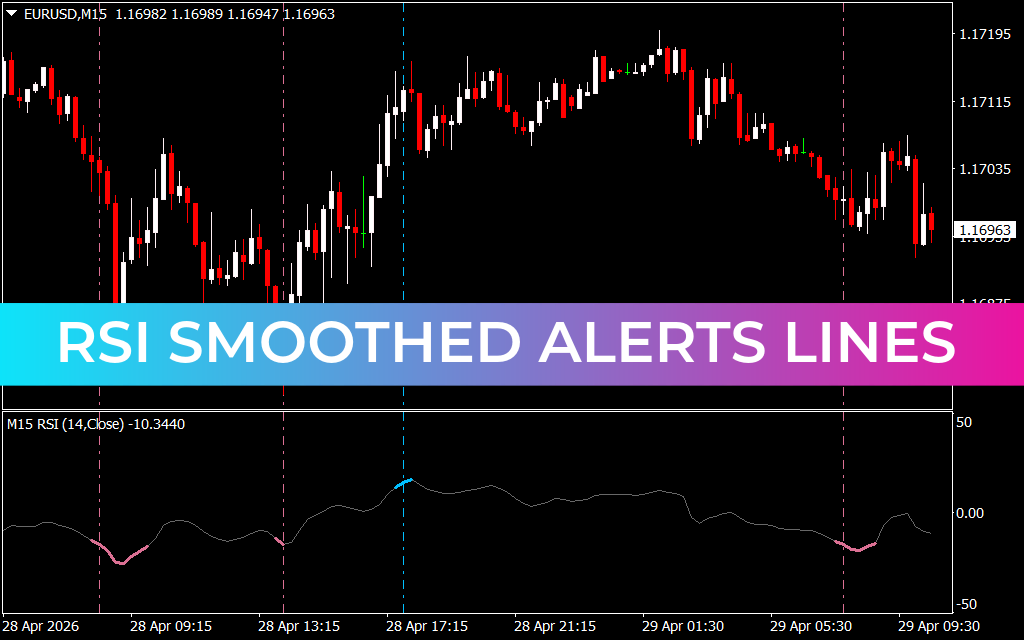
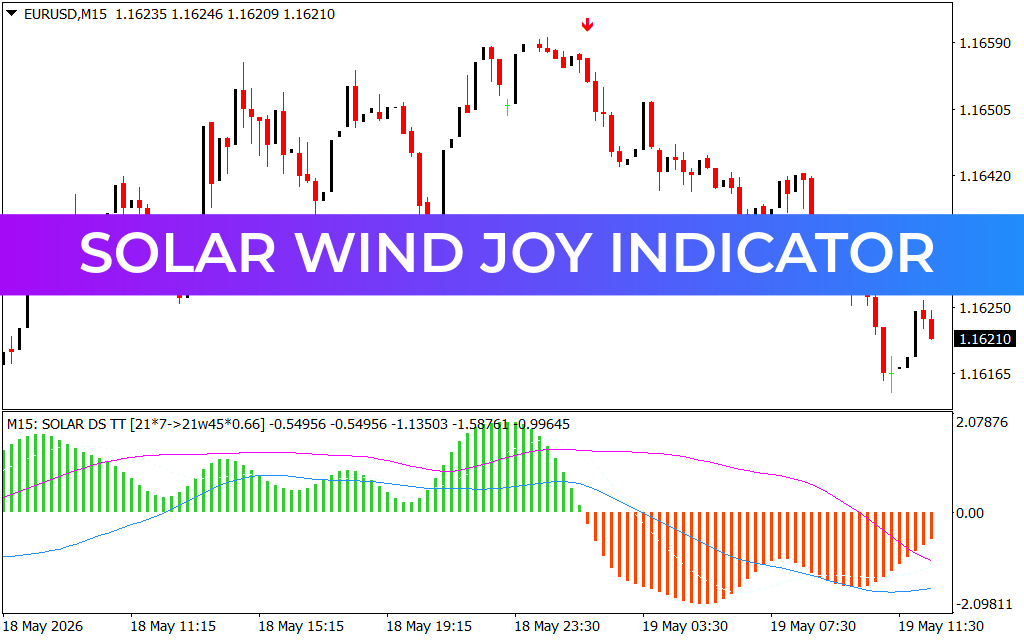
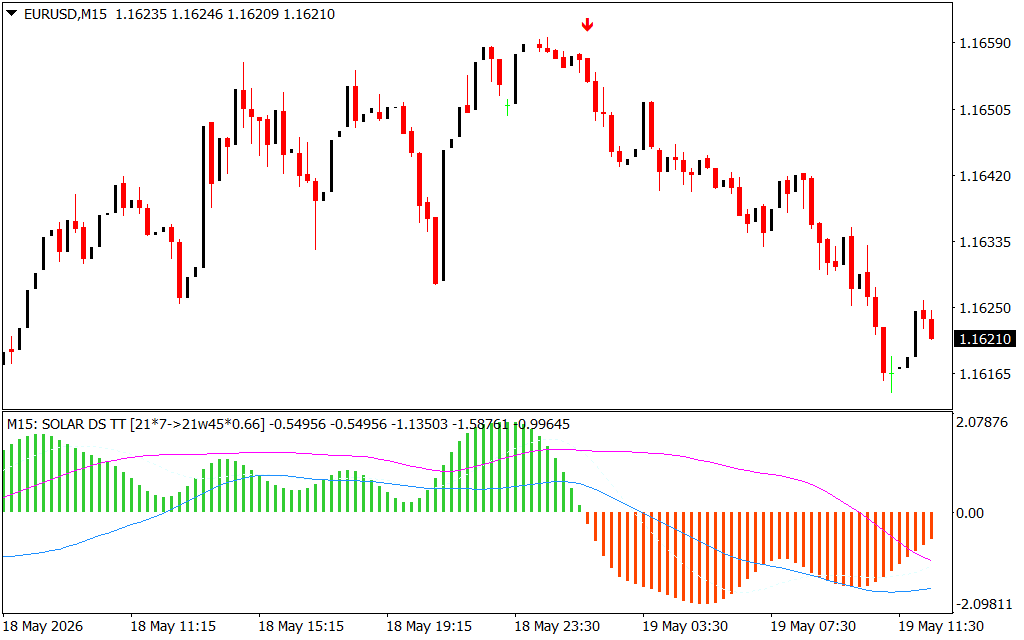
The Solar Wind Joy Indicator is a modified oscillator that measures market momentum and Trend Strength over a specific period. It is displayed in a separate window below the main price chart, typically featuring a histogram that fluctuates above and below a zero line.
- Green Bars: Indicate a bullish trend or upward momentum.
- Red Bars: Indicate a bearish trend or downward momentum.
By smoothing out minor price fluctuations, the indicator allows traders to ride prevailing trends longer while avoiding the psychological pitfalls of minor market pullbacks.
Key Features and Trading Applications
The core strength of the Solar Wind Joy Indicator lies in its versatility. It can be applied across various financial instruments, including major currency pairs like EUR/USD, and performs optimally on short to medium-term timeframes such as the 15-minute (M15) or 1-hour (H1) charts.
1. Trend Identification
The most straightforward application is identifying the dominant market bias. When the histogram bars cross above the zero line and turn green, the market is considered in an uptrend. Conversely, when the bars cross below the zero line and turn red, a downtrend is established.
2. Signal Crossovers
Traders often look for the exact moment the histogram shifts color as a potential trade trigger. A shift from red to green suggests a buying opportunity, while a shift from green to red indicates a potential short position.
3. Combining with Moving Averages
While the Solar Wind Joy Indicator is powerful on its own, it is highly susceptible to false signals during choppy, sideways markets. To maximize its efficacy, advanced traders often pair it with trend-following tools like the Exponential Moving Average (EMA). For instance, a trader might only take buy signals from the indicator if the price is also trading above a 50-period EMA.
Enhancing Your Technical Analysis
Like any technical tool, the Solar Wind Joy Indicator should not be used in isolation. Effective risk management, combined with price action analysis—such as identifying Support And Resistance levels—will significantly improve your win rate. Because the indicator is highly responsive, it serves as an excellent confirmation tool for structural breakout strategies, ensuring you enter the market precisely when momentum is shifting in your favor.
9 Downloads
Last Update:
May 19, 2026 15:37 PM
Published:
Jan 19, 2026 20:04 PM
Category: