Navigating Market Cycles with the Solar Winds Indicator
In technical analysis, mastering momentum shifts is the key to achieving sustainable trading consistency. Because financial markets continuously cycle between periods of intense vertical expansion and quiet, horizontal consolidation, retail traders often struggle to time their entries. Traditional moving averages offer trend direction but suffer from extreme lag, while standard oscillators frequently generate false signals during strong trends. The Solar Winds indicator bridges this gap, giving MetaTrader users a smoothed, highly responsive histogram to track shifting market energy in real time.
Download Solar Winds for free. Track real-time market momentum and spot high-probability trend reversals cleanly with this MT4 histogram oscillator.
The Engineering Behind the Solar Winds Algorithm
To provide an accurate reflection of market momentum without the burden of heavy indicator lag, Solar Winds applies advanced smoothing mechanics to raw Price Action. Instead of recalculating basic moving averages, its core math isolates short-term price cycles and filters out the random market noise that frequently causes premature stop-outs.
The indicator dynamically measures the velocity of price changes relative to historical volatility. It transforms this complex calculation into a beautifully streamlined statistical model that balances speed and stability. For intraday scalpers and day traders, this means the indicator is fast enough to catch early reversal points while remaining sturdy enough to keep you aligned with the true direction of institutional order flow.
Maximizing Performance with the Visual Histogram
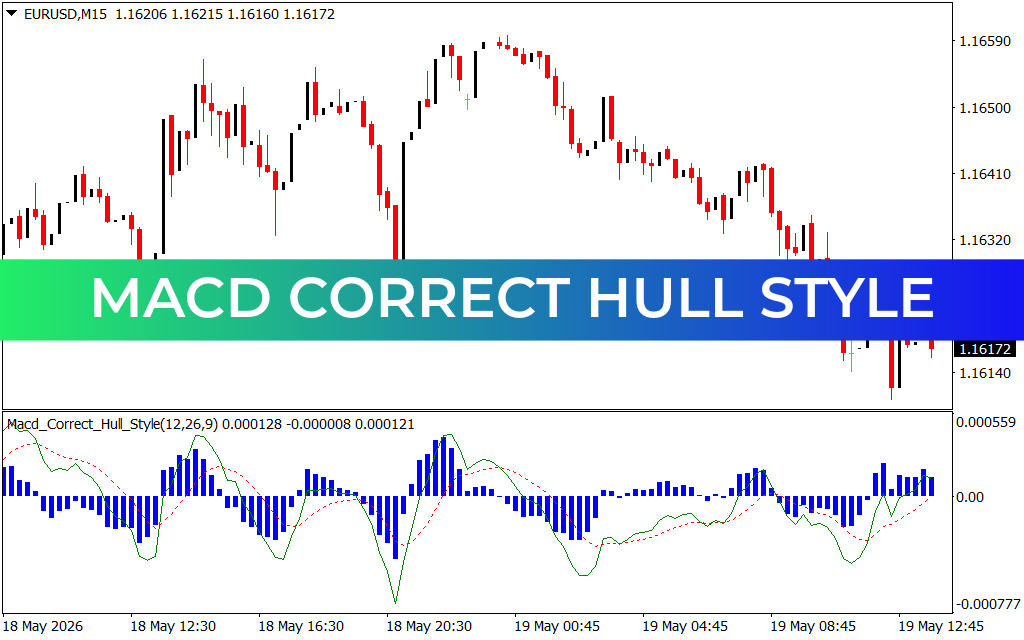
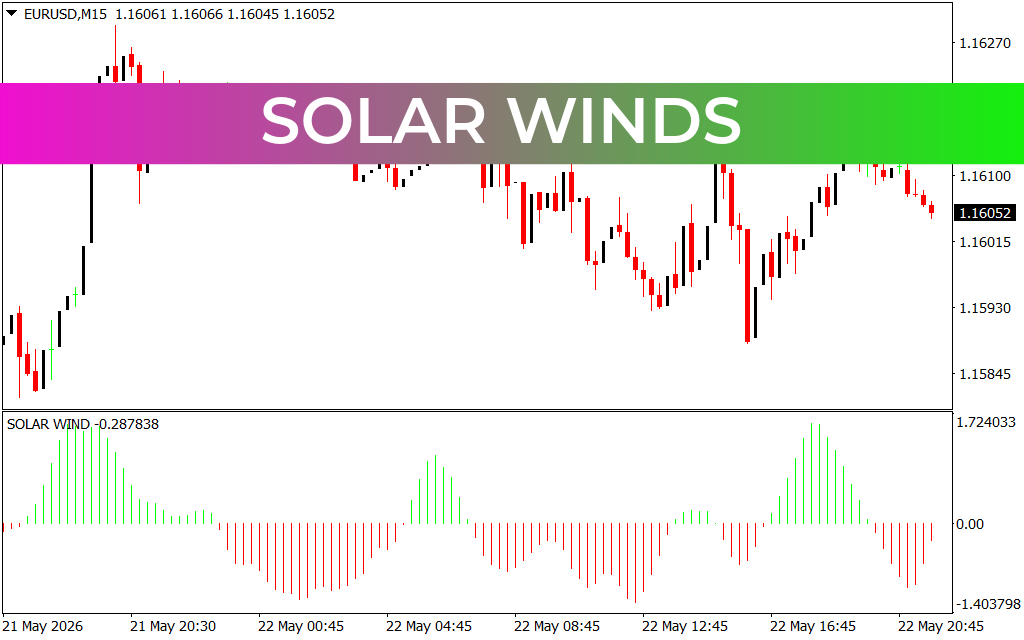
As illustrated on the EURUSD 15-minute (M15) chart, Solar Winds moves complex charting data out of your main price window and arranges it into an easy-to-read sub-window layout. This separation allows you to maintain a clean main workspace to focus on raw candle structures, liquidity levels, and chart patterns.
The indicator visualizes market momentum through a crisp, color-coded vertical histogram that oscillates around a distinct zero baseline:
- Vibrant Green Histogram Bars: Signal a dominant bullish cycle. As the bars expand upward away from the zero line, buying momentum is accelerating, confirming a healthy environment for long positions.
- Sharp Red Histogram Bars: Indicate a dominant bearish cycle. When the bars expand downward below the zero line, selling pressure is intensifying, signaling a clear markdown phase where short positions are favored.
The peak of each wave represents the maximum velocity of a trend. As the bars begin shrinking back toward the zero line, it provides an early warning that the current market cycle is exhausting, giving you ample time to tighten stop-losses or take profits.
Building a Unified Trading Strategy
The Solar Winds indicator serves as an exceptional foundation for mechanical technical systems. It thrives when paired with a trend-filtering layout—such as the multi-timeframe insights shown in companion dashboard modules like Tick Watcher.
When a higher-timeframe filter confirms a broader directional bias, traders can use Solar Winds on lower timeframes to execute trades with high precision. For instance, in an established macro uptrend, you simply wait for the Solar Winds histogram to cross from red to green, capturing the exact moment intraday momentum aligns with institutional volume.
4 Downloads
Last Update:
May 24, 2026 02:06 AM
Published:
Jan 15, 2026 20:15 PM
Category: