Decode Market Cycles with Spectrometr Separate: Advanced MT4 Spectral Analysis
In the modern trading era, Price Action is often seen as a chaotic mix of various cycles and noise. To find the true direction of the market, professional traders turn to spectral analysis. Spectrometr Separate for MetaTrader 4 is a high-tier technical indicator designed to decompose price movements into distinct frequency waves, allowing you to identify dominant cycles and anticipate reversals before they appear on standard lagging indicators.
The Science of Spectral Trading
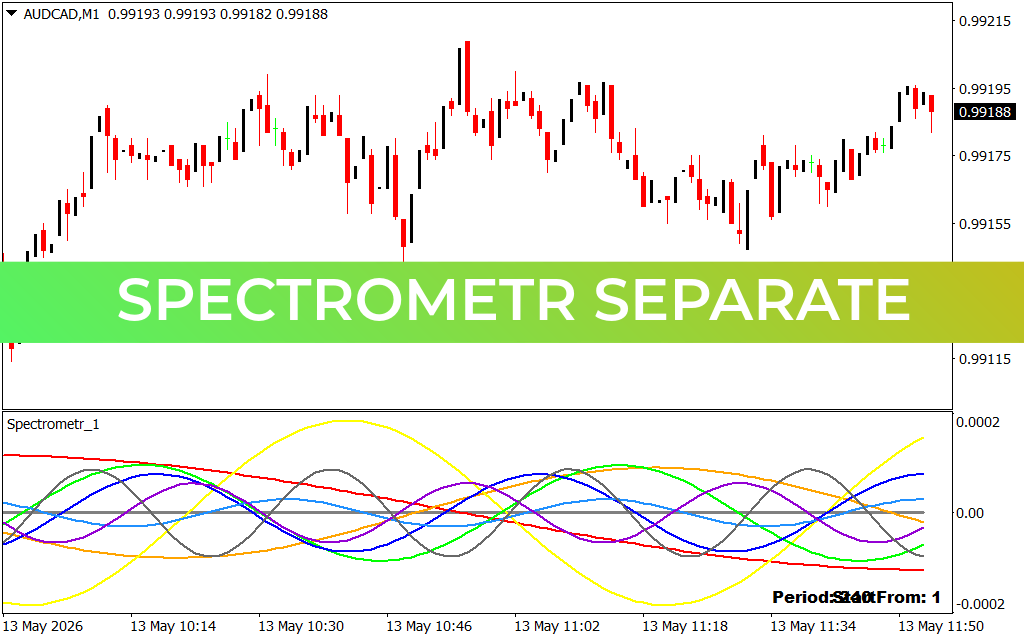
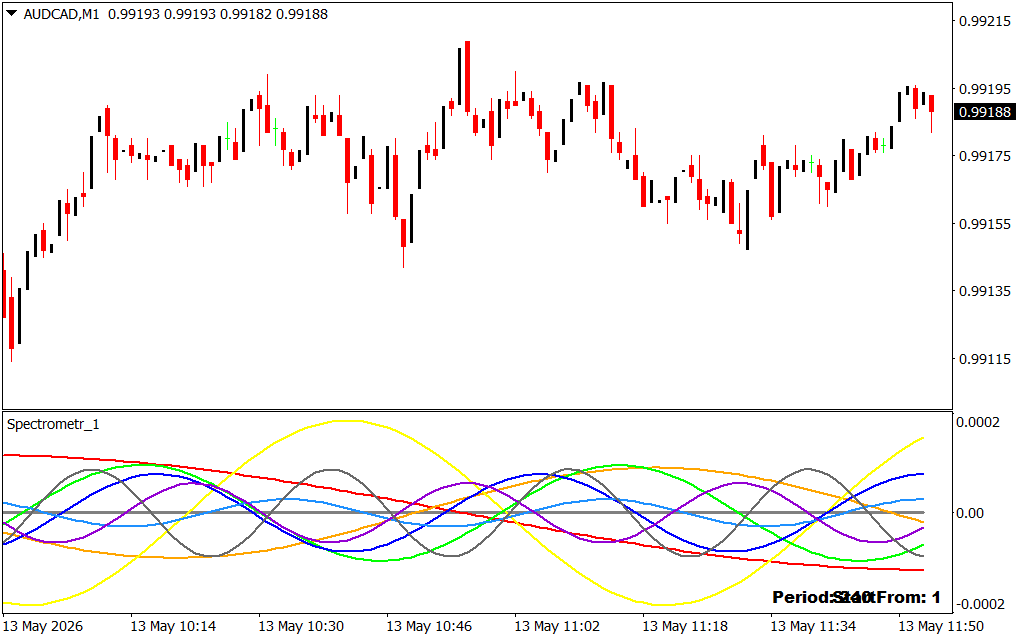
Unlike traditional oscillators that rely on simple averages, Spectrometr Separate utilizes advanced mathematical algorithms to analyze market "waves." As displayed in the AUD/CAD M1 chart, the indicator appears in a separate sub-window, featuring multiple colored sine waves (Yellow, Blue, Green, Red, and Purple). Each wave represents a different market cycle length, from short-term Scalping frequencies to longer-term intraday trends.
By observing how these waves interact, a trader can identify confluence. When multiple waves converge or cross the zero line simultaneously, it indicates a powerful shift in market energy. For example, during the session on May 13th, the convergence of the yellow and blue waves at the bottom of the spectrum signaled a prime cyclical bottom, leading to the subsequent price recovery toward 0.99188.
Key Benefits of Spectrometr Separate
- Cycle Decomposition: View the market as a series of predictable waves rather than random bars.
- Lead Time Advantage: Spectral analysis often identifies turning points faster than RSI or MACD by focusing on frequency rather than just price change.
- Multi-Frequency Smoothing: The "Separate" window format ensures your main chart remains clean while the indicator handles complex calculations in the background.
- High-Precision Scalping: On the M1 timeframe, the indicator excels at identifying "overextended" waves that are due for a reversion to the mean.
Strategy Implementation: Trading the Waves
To get the most out of Spectrometr Separate, traders look for extreme wave extensions. In the provided image, when the larger yellow wave reaches its peak amplitude (above 0.0002), the market is considered cyclically overbought. Conversely, when the waves "bottom out" at the lower boundary, it suggests a high-probability buying zone.
This tool is particularly effective for reversal traders and mean-reversion scalpers. By waiting for the short-term waves (Green and Purple) to align with the dominant long-term waves (Yellow and Red), you can enter trades with a significantly higher statistical edge. The "Period: 240 From: 1" setting shown in the chart highlights its capability to analyze substantial historical data to project future wave movements accurately.
Conclusion
Spectrometr Separate is more than just an oscillator; it is a mathematical lens that reveals the hidden structure of the Forex market. For MT4 traders who want to move beyond basic technical analysis and embrace the power of spectral frequency, this indicator is an indispensable asset. Gain a clearer understanding of market rhythm and start trading with the precision of a professional strategist today.
4 Downloads
Last Update:
May 13, 2026 14:56 PM
Published:
Jan 23, 2026 00:47 AM
Category: