The Spread Mon-Kyo Indicator is a popular and free Forex Indicator designed for the MetaTrader 4 trading platform. It is widely used by traders who want to identify trend direction, momentum shifts, and potential entry and exit points with clarity. By analyzing the spread between two moving averages, the Spread Mon-Kyo Indicator provides valuable insight into market behavior and price movement.
This indicator is suitable for traders of all experience levels due to its simple structure and visual presentation. It converts moving average data into a histogram, making it easier to interpret changes in Trend Strength and direction without cluttering the chart.
How the Spread Mon-Kyo Indicator Works
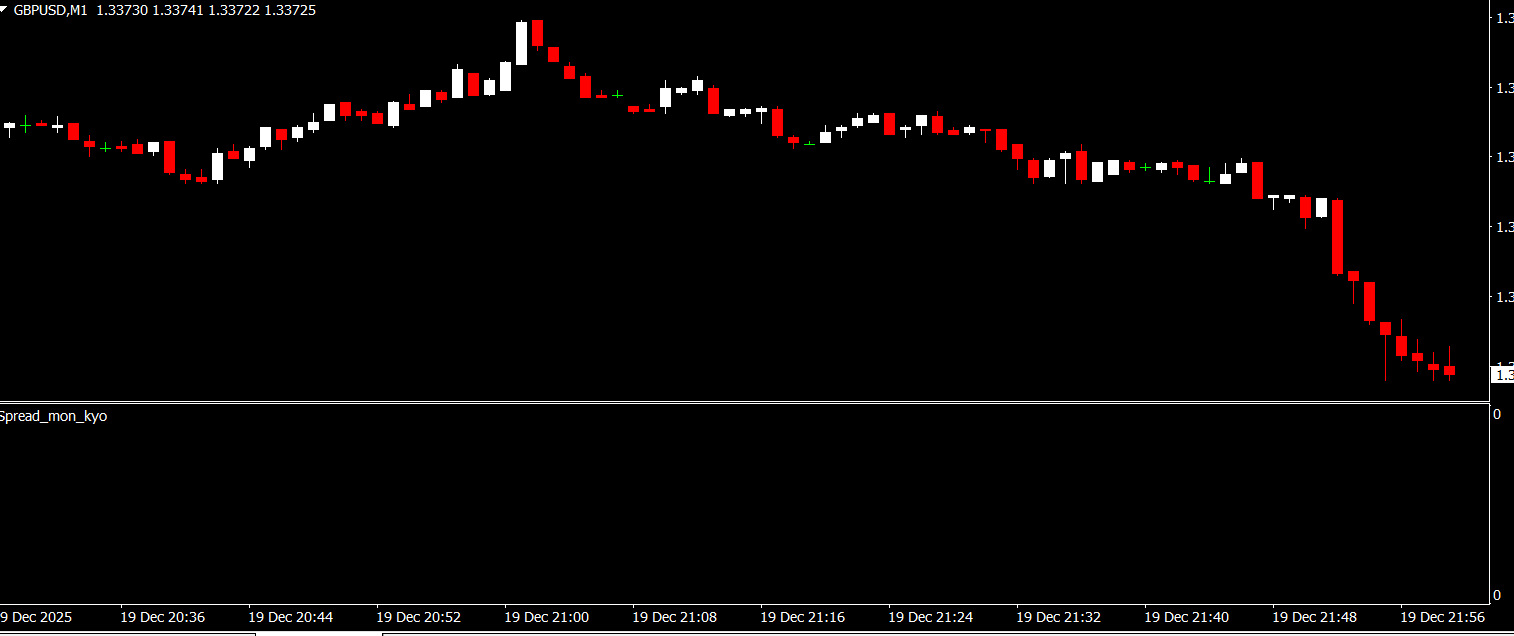
The Spread Mon-Kyo Indicator is built around two moving averages: a fast moving average and a slow moving average. These two lines represent short-term and long-term market behavior. The indicator calculates the difference, or spread, between these moving averages and displays the result as a histogram.
When the histogram moves upward, it suggests increasing bullish momentum and a potential upward trend. When the histogram moves downward, it indicates growing bearish momentum and possible downward price movement. Changes in histogram direction can signal trend shifts and potential trade opportunities.
Because the Spread Mon-Kyo Indicator reacts to the relationship between moving averages rather than price alone, it helps filter out market noise and highlights more meaningful trend changes.
Key Features and Benefits signal
Uses spread between fast and slow moving averages
Displays trend direction through a clear histogram level
Helps identify momentum changes
Highlights potential entry and exit points
Simple and easy-to-read visual design
Works on all currency pairs
Suitable for multiple timeframes
Can be combined with other indicators
Free to download and use on MT4
Using the Spread Mon-Kyo Indicator in Trading
To use the Spread Mon-Kyo Indicator, traders simply attach it to any MT4 chart. Once applied, the indicator automatically calculates and displays the moving average spread as a histogram. Traders can customize moving average periods, colors, and sensitivity settings to suit their trading style.
Many traders use the indicator as a trend confirmation tool. Buy setups are often considered when the histogram turns positive and strengthens, while sell setups may be considered when the histogram turns negative. The indicator can also be used to confirm breakouts or trend continuations when combined with Support And Resistance analysis or price action patterns.
The Spread Mon-Kyo Indicator works well for Scalping, day trading, and swing trading strategies, depending on the chosen timeframe. Using proper risk management alongside the indicator can help improve consistency and reduce false signals.
Why Traders Choose the Spread Mon-Kyo Indicator
Traders choose the Spread Mon-Kyo Indicator because it transforms complex moving average relationships into a simple and actionable visual format. Its histogram-based design makes it easy to spot momentum shifts early and react to changing market conditions.
Because it is free, flexible, and easy to understand, the Spread Mon-Kyo Indicator remains a popular choice among MT4 Forex traders looking for reliable trend signals without unnecessary complexity.
To download the Spread Mon-Kyo Indicator and explore more professional MT4 tools, visit IndicatorForest.com and enhance your Forex trading strategy today.
Image Suggest
FAQ
Published:
Dec 21, 2025 11:03 AM
Category: