Master Market Momentum with the SRSI Indicator for MT4 and MT5
In the world of technical analysis, traders are constantly seeking tools that provide a clearer picture of market momentum and potential reversal points. While the standard Relative Strength Index (RSI) is a staple in many trading systems, it can sometimes be slow to react or prone to noise in highly volatile markets. The SRSI Indicator (often referring to a smoothed or Stochastic RSI hybrid) is a sophisticated evolution of this classic tool, designed to offer higher sensitivity and more precise signals for modern traders.
What is the SRSI Indicator?
The SRSI is a momentum oscillator that takes the core logic of the Relative Strength Index and applies an additional layer of smoothing or stochastic calculation. The goal is to eliminate the "choppiness" found in standard oscillators while amplifying the overbought and oversold signals that traders rely on to find entries.
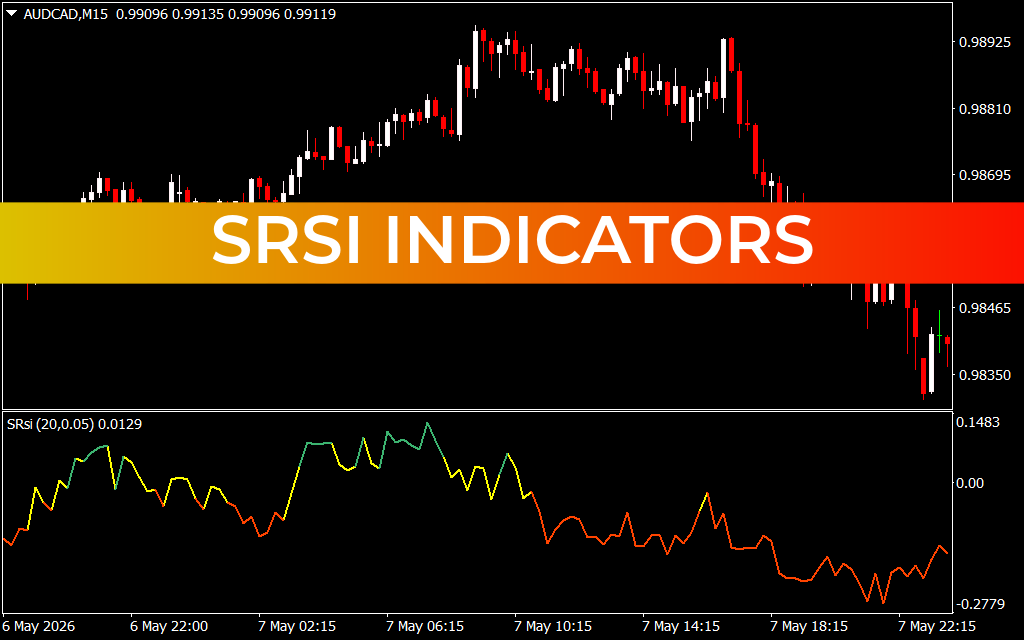
As seen in the uploaded AUDCAD M15 chart, the SRSI typically resides in a sub-window below the main Price Action. It features a signal line that oscillates between set boundaries (usually +0.14 to -0.27 in specialized versions). The line is often color-coded to represent different phases of momentum: Green for strong bullish pressure, Yellow for neutral or transitional phases, and Orange/Red for bearish dominance.
Key Features and Performance Benefits
The SRSI system offers several distinct advantages over traditional oscillators:
- Enhanced Sensitivity: By applying the Stochastic formula to RSI values, the SRSI reaches overbought and oversold extremes more frequently, providing more opportunities for mean-reversion traders.
- Momentum Color Coding: The dynamic color shifts allow traders to identify the state of the market at a glance. A transition from orange to yellow, and then green, provides a clear visual roadmap of an emerging bullish trend.
- Reduced Lag: Specialized smoothing algorithms within the SRSI help it react faster to price pivots than a standard 14-period RSI, allowing for earlier entries into new trends.
- Divergence Identification: Like all high-quality oscillators, the SRSI is an excellent tool for spotting divergence. If the price makes a new high but the SRSI makes a lower high, it serves as a powerful warning of a potential trend collapse.
Strategic Implementation
To maximize the effectiveness of the SRSI, traders should use it as a filter within a broader strategy.
- Overbought/Oversold Reversals: When the SRSI dips into the lower extreme and turns from orange to yellow, it indicates that selling pressure is exhausting. This is a prime area to look for buy setups.
- Trend Confirmation: During a strong trend, the SRSI will often "ride" the upper or lower boundaries. Staying with the color of the momentum (e.g., staying long as long as the line remains green) helps traders maximize their profit on winning trades.
- Confluence: The SRSI works best when paired with price action. If the indicator signals an oversold condition exactly at a major support level, the probability of a successful bounce increases significantly.
Conclusion
The SRSI Indicator is a must-have for traders who value precision and visual clarity. By refining the classic RSI formula, it provides a more responsive and actionable view of market momentum. Whether you are Scalping the M15 or swing trading the Daily charts, the SRSI offers the edge needed to stay ahead of market shifts.
1 Download
Last Update:
May 09, 2026 12:22 PM
Published:
Jan 25, 2026 11:57 AM
Category: