Master Market Trends with the SSL Channel Indicator for MT5
In the volatile world of financial trading, identifying the dominant trend direction is the first step toward consistent profitability. The SSL Channel Indicator has become a favorite among MetaTrader 5 (MT5) users for its ability to simplify Price Action and provide clear, visual cues for trend reversals. By creating a dynamic "channel" around the price, this tool helps traders filter out market noise and focus on high-probability setups.
What is the SSL Channel Indicator?
The SSL (Semafor Signal Level) Channel is a trend-following indicator based on modified moving averages. It consists of two distinct lines that "flip" based on whether the bulls or bears are in control of the market. Unlike standard moving averages that can often lag, the SSL Channel is designed to react swiftly to price displacement, making it an excellent tool for both scalpers and swing traders.
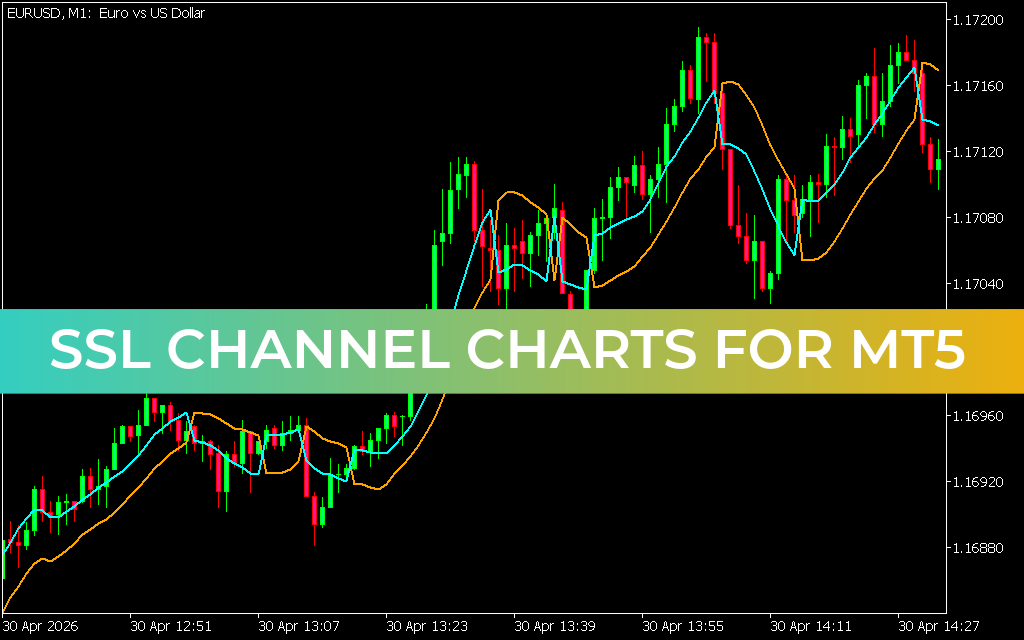
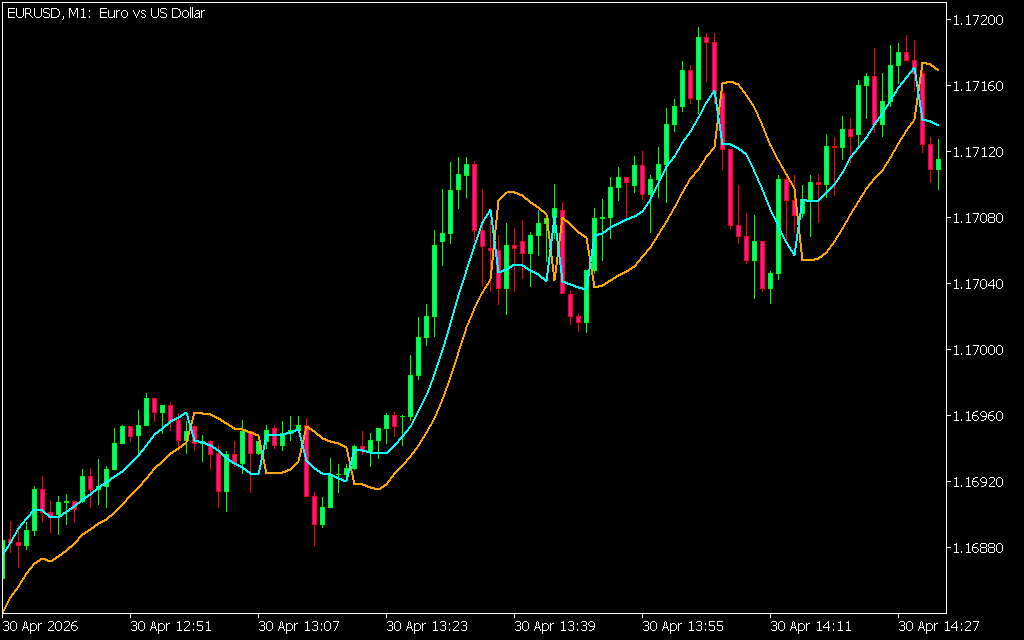
As shown in the file EURUSDM1_SSL.png, the indicator plots two colorful lines—typically an orange and a cyan line—directly on the price chart. The way these lines interact with the price candles provides immediate feedback on market sentiment.
Reading the Signals
The beauty of the SSL Channel lies in its simplicity. Traders primarily look for the "crossover" of the two lines to determine trade entries:
- Bullish Signal: When the cyan line crosses above the orange line and the price remains above the channel, it indicates that upward momentum is strengthening.
- Bearish Signal: When the orange line crosses above the cyan line and price drops below the channel, it signals a potential downtrend or a selling opportunity.
In the example chart EURUSDM1_SSL.png, you can observe several instances where the channel successfully guides the trader through a series of Higher Highs and Higher Lows on the 1-minute timeframe, highlighting its effectiveness even in high-frequency trading environments.
Why Choose SSL Channel for MT5?
The MetaTrader 5 version of the SSL Channel offers several advantages over legacy platforms:
- Multi-Timeframe Compatibility: It performs consistently whether you are analyzing a 1-minute chart for quick pips or a daily chart for long-term trends.
- Visual Clarity: The clean separation between the lines helps prevent "analysis paralysis," allowing you to see the Market Structure at a glance.
- Stop-Loss Placement: The channel lines act as dynamic Support And Resistance. Many professional traders place their stop-loss orders just outside the opposite line of the channel to protect their capital.
- Low Lag: The internal algorithm is optimized to provide faster feedback than a traditional Simple Moving Average (SMA), helping you enter trends earlier.
Strategic Integration
For the best results, the SSL Channel should be used in conjunction with a momentum oscillator or volume data. While the channel is excellent at identifying the direction of the trend, pairing it with another tool can help you identify if that trend is becoming overextended. For instance, if price is far away from the SSL lines and an oscillator shows "Overbought" conditions, it may be time to tighten your trailing stops.
Whether you are a beginner looking for an intuitive way to read charts or a veteran trader refining a complex system, the SSL Channel for MT5 is a versatile and reliable addition to any trading arsenal.
6 Downloads
Last Update:
May 01, 2026 02:50 AM
Published:
Jan 29, 2026 21:06 PM
Category: