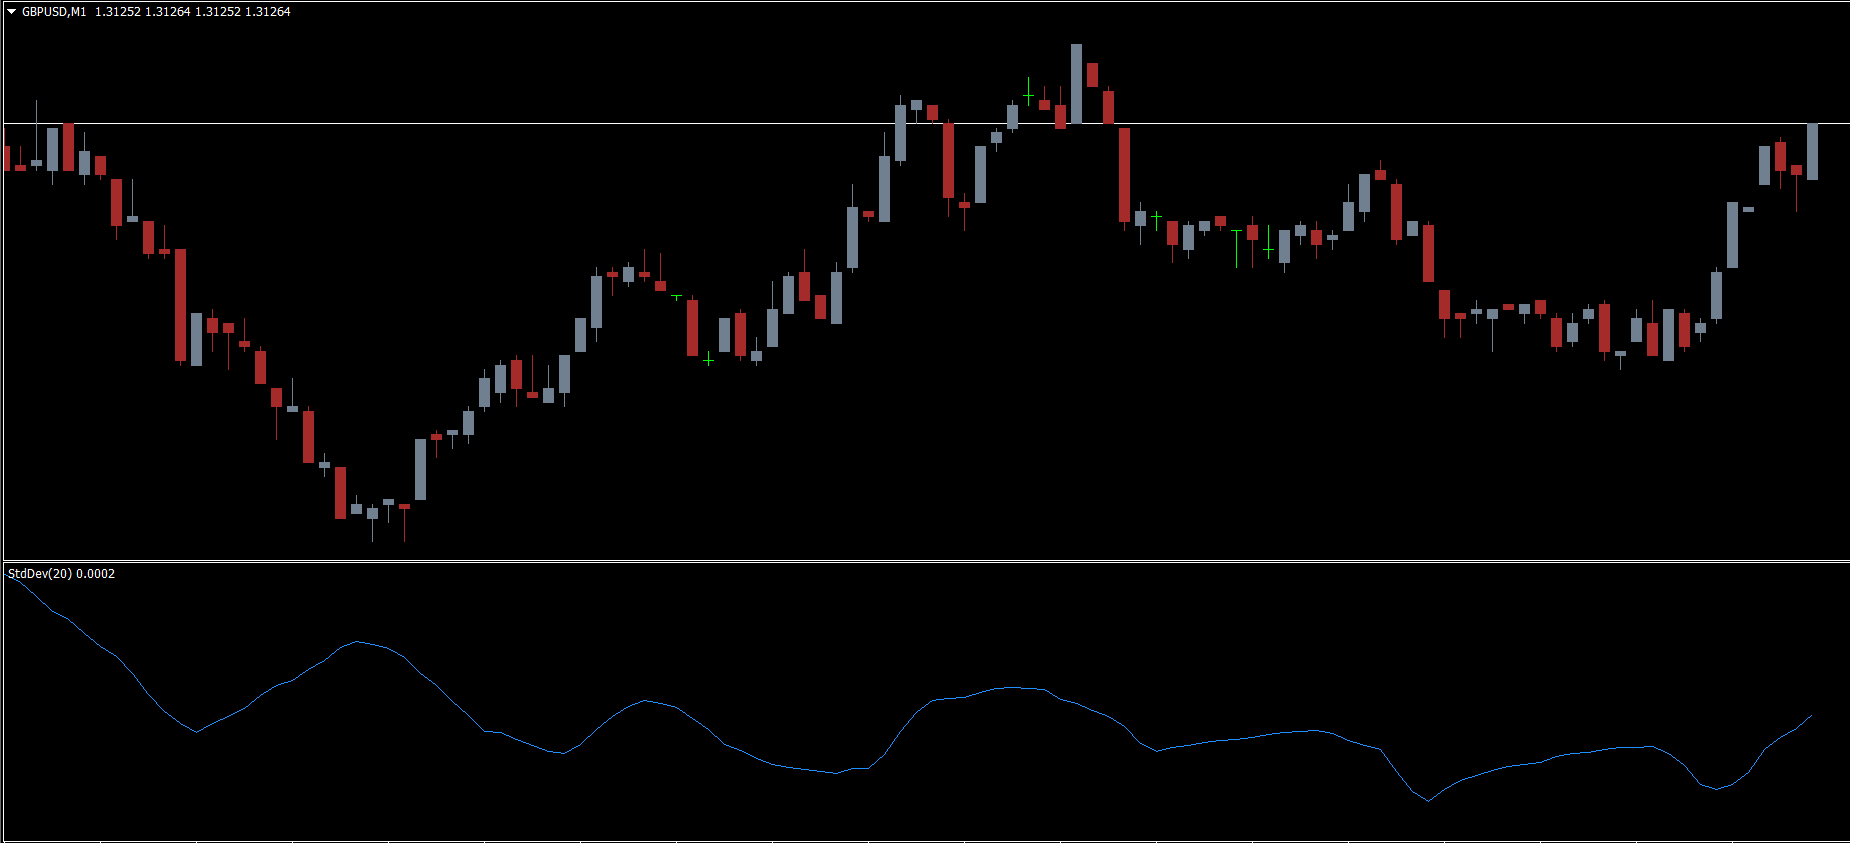
The indicator measures volatility by comparing the difference between the current price and its moving average over a selected period. When the SD value is low, it means the market is in a dormant or flat state, and price movements are small. Conversely, when the SD value increases, the market is becoming active, signaling possible breakouts or trend continuations.
According to classical statistics, price movement tends to oscillate around a mean value (or linear regression line). The Standard Deviation shows how far the current price is from that mean.
Upward deviation: Indicates dominance of sellers (price overextended on downside recovery).
Downward deviation: Indicates dominance of buyers (price extended upward).
Equilibrium zone: Price stays within upper and lower deviation bands, showing market balance.
Standard Deviation Indicator Formula
Although the calculation is complex, it follows a statistical approach applied to Price Action:
StdDev(i)=∑(ApPrice(in)−SMA(ApPrice(i),n,i))2nStdDev(i) = \sqrt{\frac{\sum (ApPrice(in) - SMA(ApPrice(i), n, i))^2}{n}}StdDev(i)=n∑(ApPrice(in)−SMA(ApPrice(i),n,i))2
Where:
StdDev(i) = Standard Deviation of the current candle
n = Period (number of bars)
ApPrice(i) = Applied price (close, open, etc.)
SMA(ApPrice(i), n, i) = Moving average over n periods
In practice, traders rarely need to calculate it manually—MetaTrader 4 performs it automatically.
How to Use the Standard Deviation Indicator in Trading
Despite the technical background, using the indicator is simple. The line’s direction and intensity give clear clues about market volatility and upcoming movements.
Flat Market (Low SD Values)
When the Standard Deviation remains low and flat, it indicates low volatility. Traders should prepare for a possible breakout, as price consolidation often leads to strong directional moves.
Rising SD Line
A sharp increase in the indicator line means rising volatility. This often follows a breakout or the beginning of a new trend phase. The faster the line rises, the stronger the potential price movement.
Falling SD Line
A declining SD value signals decreasing volatility and potential range-bound movement. It’s usually a time to tighten stops or take profits if you’re in a trade.
Trading Strategy Example (Sell Setup)
Wait for the SD indicator to show a flat, low phase (market consolidation).
Once it starts rising, confirm that a bearish candle appears.
Enter a Sell trade after confirmation.
Place Stop Loss above the local swing high.
Set Take Profit near the next key support or horizontal level.
This method works best when combined with a confirmatory indicator such as RSI, Bollinger Bands, or Moving Averages.
👉 [Internal link placeholder: Use alongside Bollinger Bands Indicator for MT4]
Why Use the Standard Deviation Indicator?
Identifies active vs. dormant market states
Helps spot breakouts before they happen
Works on all timeframes and currency pairs
Complements trend and volatility indicators
Simple to read and integrate into any strategy
Conclusion
The Standard Deviation Indicator for MetaTrader 4 is a reliable tool for detecting market volatility and anticipating breakout zones. It doesn’t generate direct buy/sell signals but serves as an excellent confirmation tool for traders seeking high-probability setups. Whether you trade trends or ranges, understanding volatility phases through this indicator can help you make more informed trading decisions.
For better accuracy, combine it with other trend or momentum indicators to improve your overall strategy performance.
👉 [Internal link placeholder: Explore our Trend Indicators Collection]
FAQ
3 Downloads
Published:
Nov 12, 2025 23:05 PM
Category: