The Starc Bands Indicator for MT5 is one of the most effective volatility and trend-reversal tools available to Forex traders. Similar to Bollinger Bands, it surrounds price within dynamic boundaries, helping traders identify overbought and oversold regions. Because the indicator is based on a combination of simple moving averages (SMA) and average true range (ATR), it offers a precise, adaptable view of market volatility. Whether you are a beginner or an advanced trader, this indicator provides clear, actionable insights ideal for Scalping, intraday, and swing trading. You can explore more powerful tools like this at IndicatorForest.com.
How the Starc Bands Indicator Works
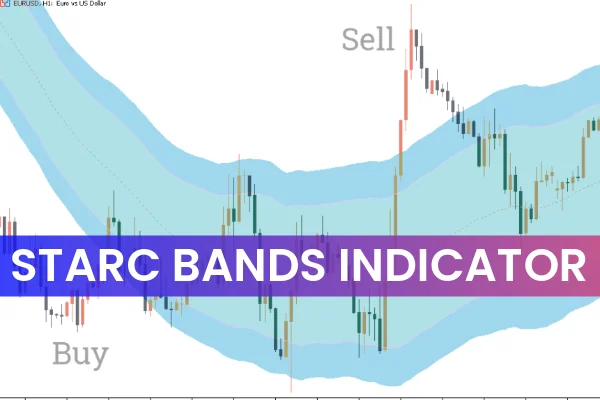
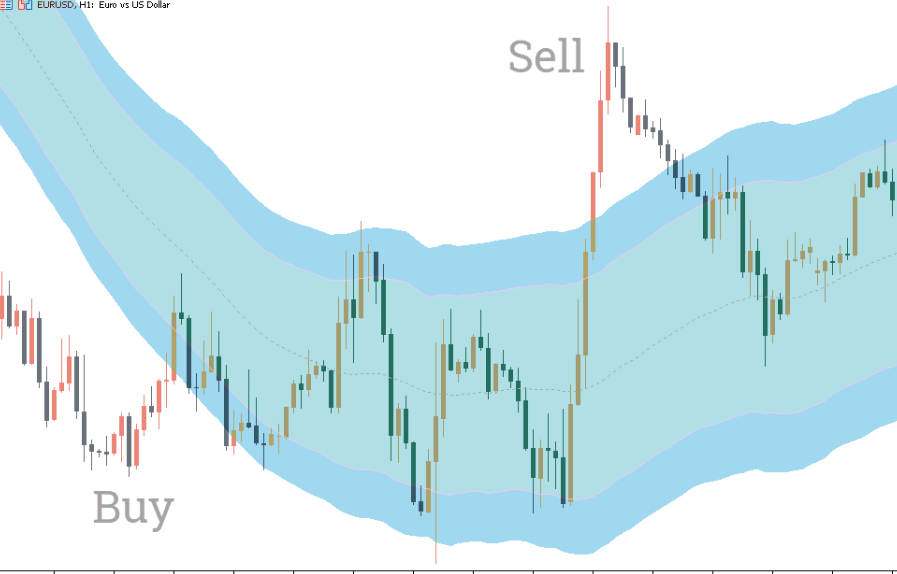
The Starc Bands consist of three primary elements: an upper band, a lower band, and a trend-identifying middle line. While visually similar to Bollinger Bands, Starc Bands differ in calculation and purpose, making them better suited for reversal-focused strategies.
Simple Moving Average Foundation
The core of the Starc structure is a simple moving average (SMA). This moving average functions as the central trend line, helping traders identify market direction. A price above the SMA generally reflects bullish momentum, while price below indicates bearish sentiment.
ATR-Based Upper and Lower Bands
Both outer bands are created by adding or subtracting the ATR from the SMA:
Upper Band = SMA + ATR
Lower Band = SMA – ATR
This ATR-based approach allows the bands to react dynamically to volatility. When volatility increases, the bands widen. When markets calm, the bands tighten. This reaction gives traders a real-time picture of potential price extremes.
Benefits of Using the Starc Bands Indicator for MT5
The indicator is popular among Forex traders because it:
Helps identify high-probability reversal zones
Requires minimal price-action experience
Works effectively across multiple timeframes
Adjusts automatically to volatility changes
Highlights optimal trade-entry levels
Enhances risk management through visual boundaries
The clarity of the channel makes the Starc Bands ideal for those who want a clean, simple chart setup that still provides high-reward opportunities.
Identifying BUY and SELL Signals with Starc Bands
BUY Signal Strategy
A BUY/LONG opportunity forms when:
Price touches or dips under the lower Starc band.
A strong rejection wick appears, signaling exhaustion.
The next candle closes bullish (GREEN) and shows additional rejection.
This combination indicates that price has reached an oversold level and is preparing to reverse back toward the middle or upper band.
Pro tip: A double-wick rejection on the lower band is one of the strongest reversal patterns when combined with this indicator.
SELL Signal Strategy
A SELL/SHORT setup appears when:
Price reaches or pierces the upper Starc band.
A downward rejection wick becomes visible.
The next candle closes bearish (RED) and also forms a wick.
This signals overbought conditions and a likely reversal downward.
Using Starc Bands with Other Indicators
While powerful on its own, the Starc Bands Indicator becomes even more effective when paired with complementary tools such as:
RSI or Stochastic (for overbought/oversold confirmation)
Support And Resistance mapping
Trendlines
Higher timeframe analysis
Combining volatility channels with momentum and structure-based tools creates a well-rounded trading approach.
Conclusion
The Starc Indicator for MT5 is a reliable, efficient, and user-friendly tool for traders seeking accurate trend reversal signals. Its ATR-driven bands adapt to changing market conditions, allowing you to identify optimal entry and exit zones with confidence. Since the indicator is free to download, consider testing it to refine your Forex strategy. Explore more MT5 and MT4 tools at IndicatorForest.com.
FAQ
8 Downloads
Published:
Nov 13, 2025 22:58 PM
Category: