The SupDem Indicator is a powerful tool designed to help forex traders identify key Supply And Demand zones. By analyzing sharp price reversals, the indicator determines:
Demand zones (support): When price turns sharply upward
Supply zones (resistance): When price turns sharply downward
The SupDem Indicator focuses purely on Price Action, summarizing all market forces—whether fundamental or technical—into actionable levels on the chart.
How the SupDem Indicator Works
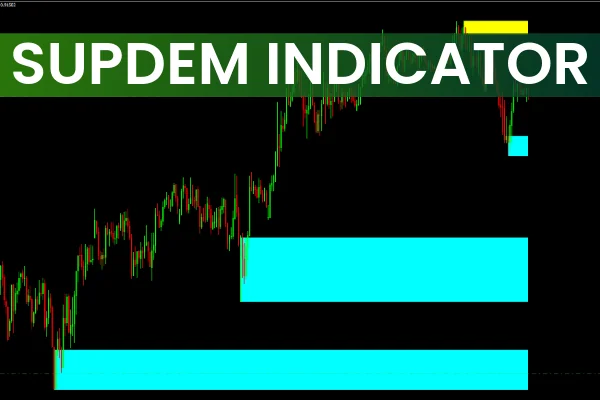
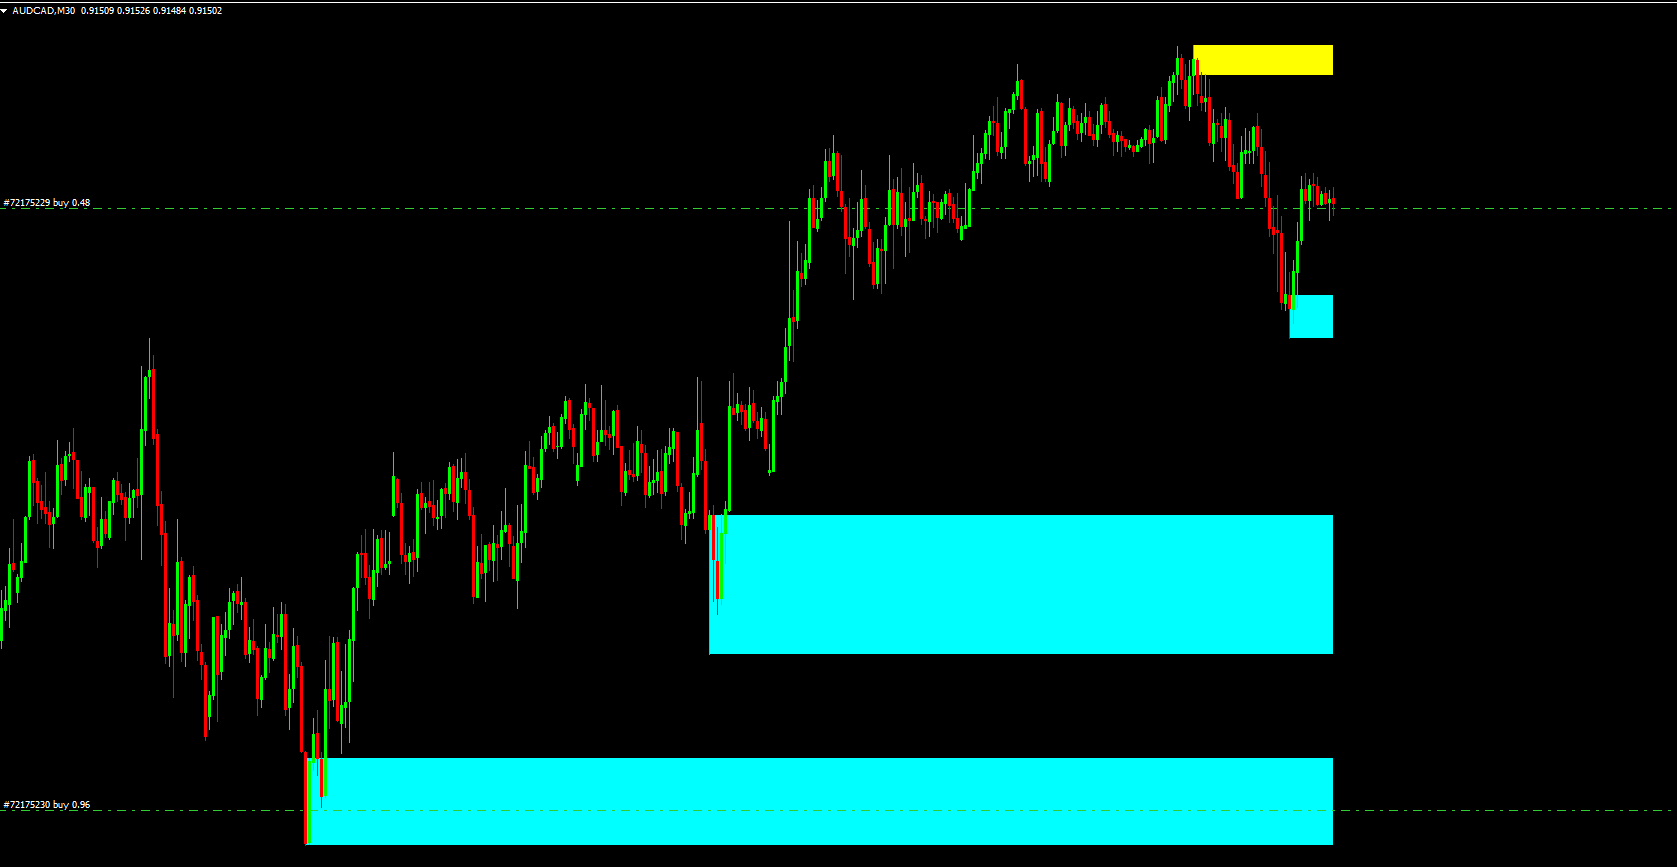
The indicator plots:
Support zones in blue
Resistance zones in yellow
Once the price breaks through these zones, the indicator automatically removes them, keeping the chart clean.
Unlike standard indicators, SupDem does not provide automatic buy or sell arrows. Traders have the freedom to use these zones strategically based on their trading style.
Trading Strategies Using SupDem Indicator
Intraday Trading Example
Place a sell-limit order at the lower boundary of a resistance zone
Place a stop loss above the upper boundary of the resistance zone
Target profits near the previous local low
Ensure a favorable risk-to-reward ratio
Combining with Other Indicators
Identify a supply zone
Wait for price to return to this zone
Enter a short position using a confirmation from an indicator like CCI
Close the trade on the opposite signal of the chosen indicator
SupDem can be combined with any other indicator you trust, while keeping risk management as a priority.
Advantages of the SupDem Indicator
Highlights critical supply and demand zones
Non-repainting and reliable for historical analysis
Works across different timeframes
Flexible: can be combined with other indicators for trade confirmation
Helps traders focus on important market levels rather than generating blind signals
The indicator emphasizes smart entries and exits by showing zones rather than automatic signals, allowing traders to apply their own strategies.
Conclusion
The SupDem Indicator for MT4 is an essential tool for forex traders who want to trade around key Support And Resistance levels. By visualizing supply and demand zones, the indicator helps traders identify strategic entries and exits. Although it does not guarantee 100% accurate signals, it provides valuable market context for both novice and advanced traders. For risk-free practice and free download, visit IndicatorForest.com and start using the SupDem Indicator today.
FAQ
3 Downloads
Published:
Nov 30, 2025 01:07 AM
Category: