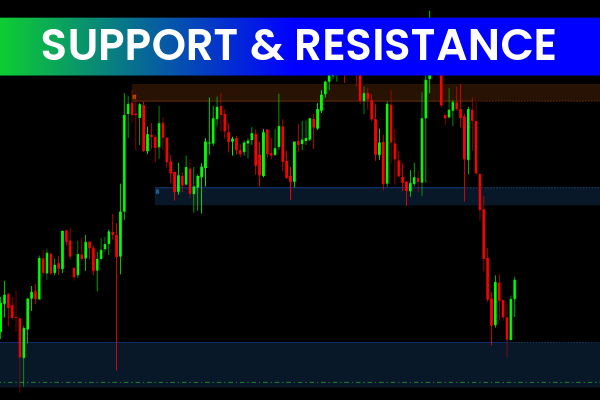
The Support & Resistance Indicator for MT4 is a powerful technical tool designed to identify Trend Reversal and continuation zones in the financial markets. Instead of manually drawing horizontal levels, this indicator automatically charts major support and resistance zones where price frequently reacts, reverses, or breaks through. These zones act as critical decision points for Forex traders seeking accurate signals for entries, exits, and Trend Continuation opportunities.
Because financial markets move in cycles, understanding where the price is likely to react provides a significant trading advantage. The Support & Resistance Indicator allows traders to visually confirm these critical levels directly on the MetaTrader 4 chart.
What Is the Best Indicator for Support & Resistance?
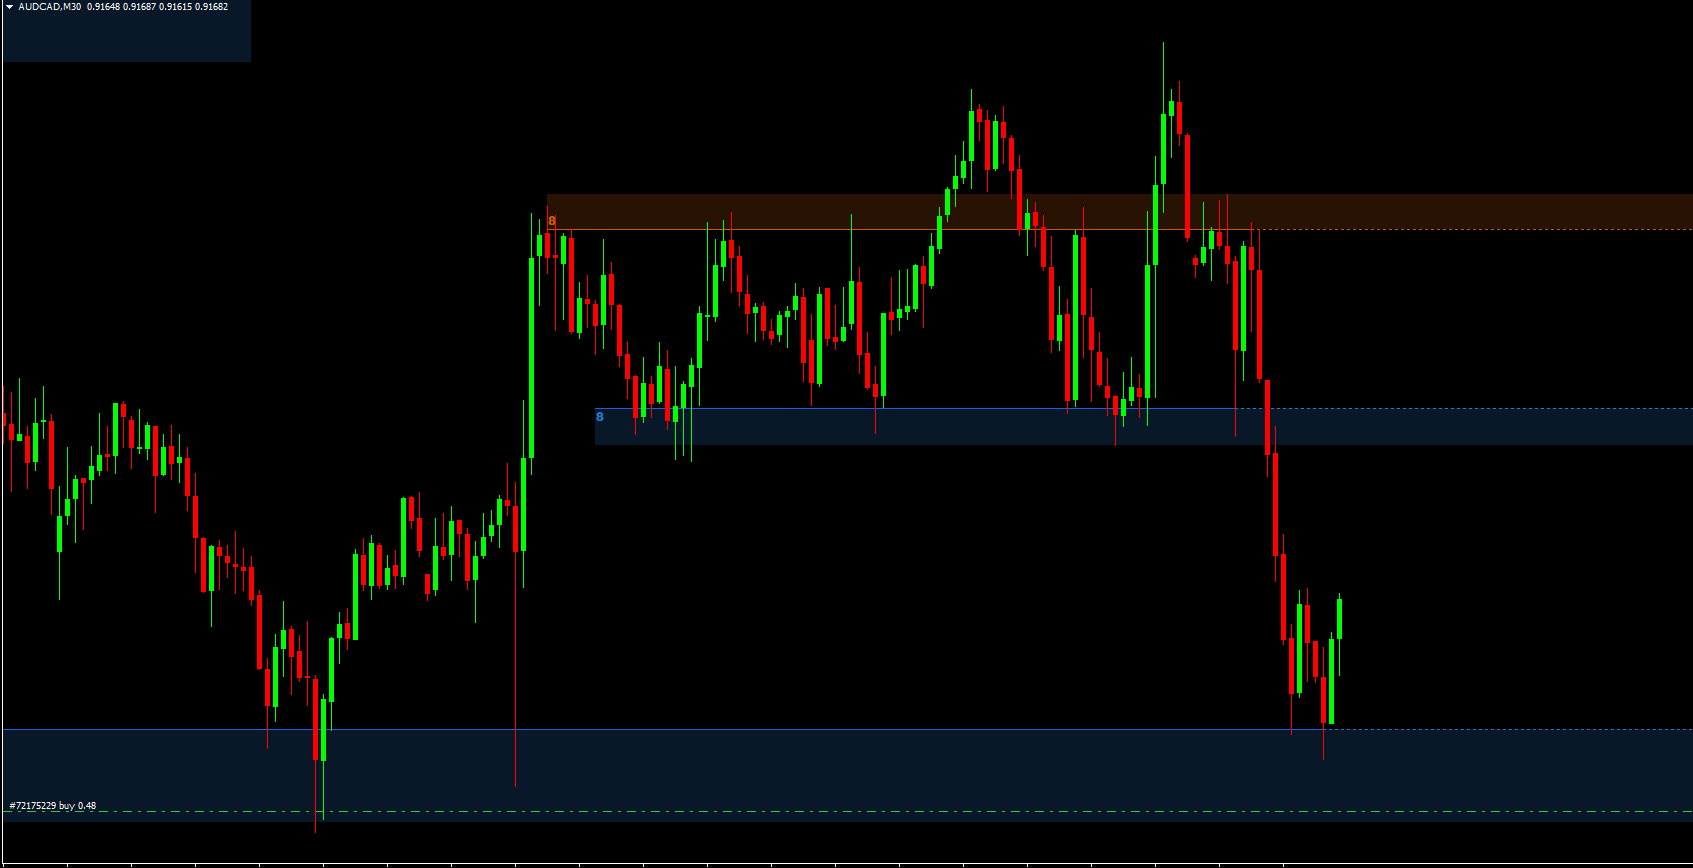
One of the most effective and accurate tools for detecting key Support And Resistance zones is the Support & Resistance Indicator for MT4. Unlike basic indicators that draw simple lines, this tool places dynamic zones, which account for real market structure and volatility. Trading with zones is significantly more reliable because price rarely reacts at a single line—it reacts within a region.
A unique feature of this indicator is its ability to highlight how many times price has tested each zone. Multiple tests suggest a strong level, while fewer touches indicate a weaker or developing zone. This information helps traders predict whether a zone is more likely to hold or break, improving decision-making in both trending and ranging markets.
Features of the Support & Resistance Indicator
Customizable Parameters
Traders can fully adjust the indicator settings to match their preferred trading style. Whether you trade intraday or longer-term Price Action, the indicator adapts to various market conditions.
Automatic Projections
The indicator also generates projected future support and resistance zones. These projections help traders understand where the price may react next, enabling proactive planning instead of reactive decision-making.
Zone Retest Counter
One of the standout features is the indicator’s counter, which shows how many times a zone has been tested. This is extremely valuable because:
A frequently tested zone becomes stronger
A zone that is tested too often may weaken and eventually break
Traders can anticipate potential breakout scenarios
Benefits of Using the Support & Resistance Indicator
Identifies Key Market Levels
The indicator automatically marks the most relevant lows and highs, helping traders detect zones where price action historically shows a high likelihood of reversal. These levels are essential for scalpers, intraday traders, and swing traders alike.
Enhances Risk Management
Support and resistance levels are natural boundaries for managing risk. With these zones visible:
Traders can tighten or close buy positions near strong resistance
They can secure profits or reduce risk when price approaches support
Stop-loss placement becomes more strategic and precise
Ideal for Reversal and Continuation Trading
The Support & Resistance Indicator helps traders identify potential:
Trend reversals after price retests a key zone
Breakouts when price pushes through a major level
Pullbacks where traders can enter positions in the direction of the trend
This makes the indicator suitable for a wide range of trading strategies, including breakout trading, Price Action Trading, and trend continuation setups.
How Traders Typically Use the Indicator
A common practical approach includes:
Watching for price rejections at zones for reversal trades
Entering breakouts when strong zones finally give way
Using the number of retests as confirmation of zone strength
Combining the indicator with candlestick patterns for accuracy
Aligning trades with market structure for trend confirmation
Conclusion
The Support & Resistance Indicator for MT4 is an essential tool for traders who want to understand market structure, identify accurate reversal points, and plan breakout trades with confidence. Its automatically generated zones, retest counter, and customizable features make it a valuable asset for traders of all levels. To access more premium MT4 and MT5 indicators, visit IndicatorForest.com.
FAQ
7 Downloads
Published:
Dec 11, 2025 02:25 AM
Category: