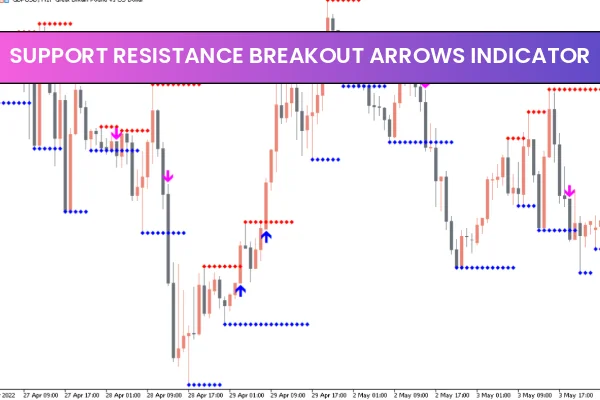
The Support Resistance Breakout Arrows Indicator for MT5 is designed for intraday forex traders who rely on breakout strategies, trend continuation methods, and support-resistance-based entries. This non-repainting indicator combines Fractals, CCI, and RSI to generate accurate BUY and SELL arrows while automatically plotting major Support And Resistance zones. With its clear structure and multi-confirmation logic, this MT5 tool helps traders make faster, more precise decisions in any market condition.

Support and resistance levels have always been core elements of technical analysis. By integrating these with strong momentum filters, the Support Resistance Breakout Arrows Indicator becomes an ideal solution for beginners and advanced forex traders seeking reliability and simplicity.
How the Support Resistance Breakout Arrows Indicator Works
This MT5 indicator focuses on Market Structure and momentum. It detects fresh swing highs and lows using Fractals, verifies strength using CCI, and checks overbought/oversold conditions using RSI. Only when these elements align does it display a BUY (blue) or SELL (magenta) arrow.
The indicator also automatically draws major Support and Resistance (Sup&Res) levels, color-coded as:
Blue – Support
Red – Resistance
These levels act as decision zones for entries, exits, and adding positions during a trending market.
Trading Signals Explained
The indicator offers two types of signals:
BUY Arrow (Blue):
Appears when price breaks above a support or resistance line with momentum confirmation. Traders can choose to open multiple positions during an uptrend, as additional BUY arrows often appear before a major reversal.
SELL Arrow (Magenta):
Signals bearish breakouts combined with CCI and RSI confirmation. Positions can be opened on each magenta arrow until the trend ends or the opposite blue arrow appears.
Unlike lagging indicators, the Support Resistance Breakout Arrows Indicator does not repaint, making its signals trustworthy for both manual and automated strategies.
Support & Resistance: The Core Structure Behind the Indicator
The indicator is not based on pivot calculations. Instead, it identifies the most relevant support and resistance zones using a combination of fractal swings and momentum readings. This method gives traders:
High-accuracy reversal zones
Logical entry and exit areas
Clear trend structure
Automatically detected levels for scaling into trends
This makes the tool useful for intraday traders, swing traders, and multi-timeframe analysts.
Using CCI and RSI Filters
The built-in filters help traders avoid false breakouts by analyzing:
CCI strength: Confirms momentum direction
RSI levels: Avoids entries during extreme overbought or oversold zones
Traders can adjust the indicator settings to match their strategy, whether conservative or aggressive.
Multi-Timeframe Trading Advantage
Though popular for M5, M15, and H1 intraday charts, the Support Resistance Breakout Arrows Indicator works on all timeframes, including H4, Daily, and Weekly.
Short-term traders benefit from rapid breakout signals
Long-term traders can use strong Sup&Res levels for major swing entries
Advanced traders can combine MTF signals, such as trading H1 arrows aligned with H4 structure
Why This Indicator Is Ideal for Beginners and Professionals
The combination of clarity, automated analysis, and non-repainting signals makes the indicator valuable for all trader types.
Key benefits include:
Non-repainting BUY/SELL arrows
Automatic support and resistance detection
Multiple entries during trends
CCI and RSI filtering for more accurate trades
Works on all forex pairs and timeframes
Simple enough for beginners, powerful for experts
To access more premium and free MT4/MT5 indicators, visit IndicatorForest.com and explore our complete collection.
FAQ
27 Downloads
Published:
Dec 01, 2025 22:21 PM
Category: