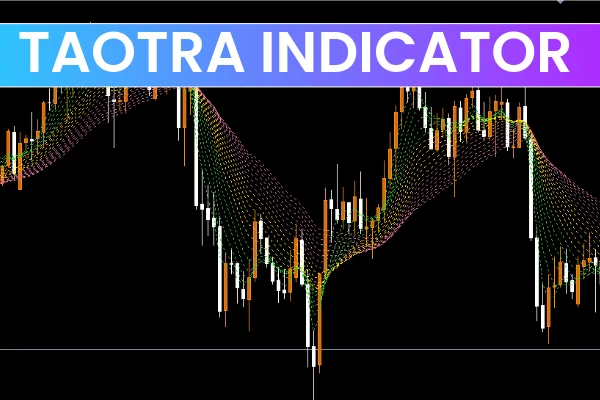
The Taotra Indicator is a unique trend-following tool that uses 20 different LWMAs to identify market direction through crossover signals. These moving averages are color-coded to form a colored cloud on the chart, helping traders quickly recognize bullish and bearish trends.
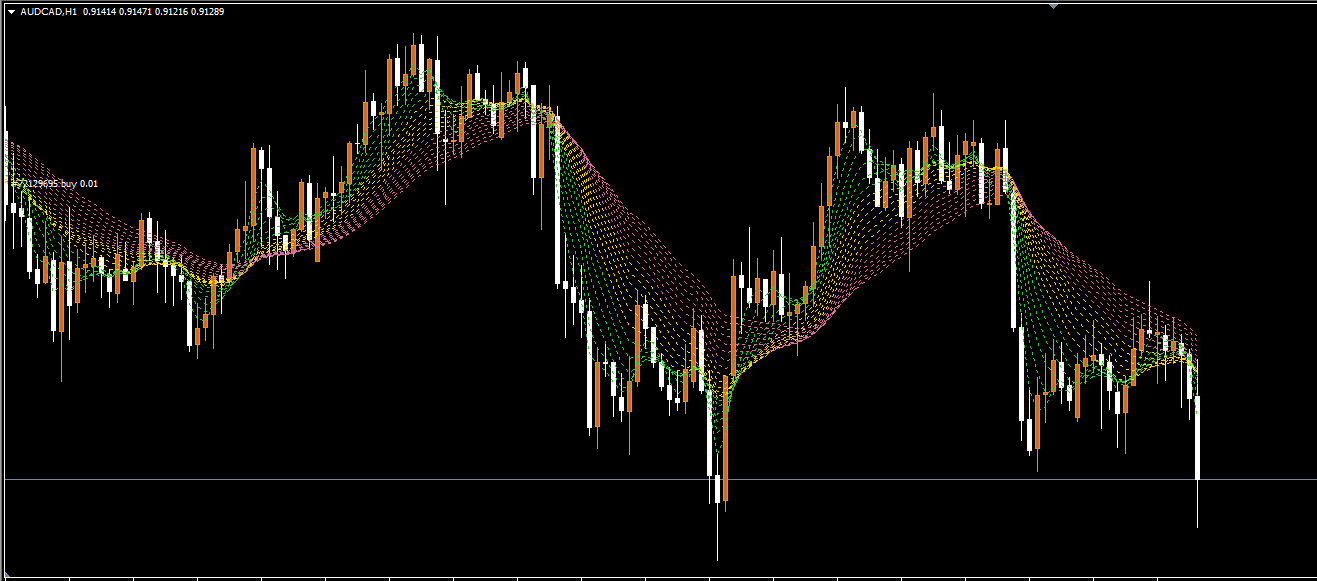
Unlike standard indicators that rely on static support or resistance, Taotra’s cloud dynamically adjusts to price movements. This makes it an excellent choice for identifying real-time market conditions and key decision zones.
The indicator is compatible with all MT4 timeframes, making it suitable for day traders, swing traders, and long-term investors. It also supports multi-timeframe (MTF) analysis and works across different asset classes, including forex, stocks, and cryptocurrencies.
How to Trade Using the Taotra Indicator in MT4
Understanding the Moving Averages
The Taotra Indicator uses three types of moving averages:
Fast MA (Green): Detects short-term market movements.
Slow MA (Red): Identifies the broader trend direction.
Mid MA: Acts as a dynamic trend line and helps confirm price behavior.
When these lines interact, they form crossover patterns that help traders determine whether the market is bullish or bearish.
Bullish Signal – Green Above Red
A bullish crossover occurs when the green MA crosses above the red MA.
This indicates a potential uptrend in the market.
Enter buy trades when the price retraces toward the mid-MA and respects it as a support level.
Set your stop-loss below the red MA cloud.
Exit the trade when the green cloud falls below the mid-MA line, signaling potential reversal or weakness.
Bearish Signal – Green Below Red
A bearish crossover forms when the green MA moves below the red MA, indicating a downtrend.
Open sell positions when price retests the mid-MA as resistance and shows rejection with bearish candlestick patterns (like bearish engulfing or pin bars).
Set a stop-loss above the red cloud.
Consider trailing your stop along the slow MA as the price moves in your favor.
Dynamic Support and Resistance
The Taotra cloud doesn’t just signal trend direction—it also acts as dynamic Support And Resistance.
During bullish markets, the cloud forms support zones, while in bearish markets, it becomes a resistance barrier.
This adaptive feature helps traders make smarter entries and exits without relying on static horizontal lines or external tools like Fibonacci or Pivot Points.
Why Use the Taotra Indicator?
Multi-LWMA precision: Improves trend accuracy.
Clear color-coded visualization: Perfect for beginners.
Dynamic S/R zones: Adapt to real-time Price Action.
Supports multiple timeframes: Ideal for intraday and swing trading.
Works across markets: Forex, stocks, and crypto compatible.
Conclusion
The Taotra Indicator for MT4 is one of the most effective moving average-based tools for identifying reliable market trends. With its color-coded crossover signals, dynamic support and resistance zones, and multi-timeframe compatibility, Taotra stands out as a complete solution for traders seeking clarity in trend analysis.
Beginner traders will find it easy to interpret, while advanced traders can use it to enhance their existing systems. Whether you’re trading forex, stocks, or cryptocurrencies, Taotra brings simplicity, accuracy, and confidence to your trading strategy.
FAQ
Published:
Nov 07, 2025 08:47 AM
Category: