The Target Bands indicator for MT4 is a channel-based technical analysis tool designed to help traders identify potential trend reversals with precision. It uses upper and lower dynamic bands to highlight exhaustion zones—areas where the market is likely overbought or oversold. When the price touches or pierces these bands, a reversal often follows. The indicator also signals when price is likely to return to the bands after a breakout, making it an essential tool for intraday traders, scalpers, and anyone trading on the MetaTrader 4 platform.
Built on a smart algorithm that uses a 55-bar look-back period, the Target Bands indicator evaluates historical price behavior to determine the most probable turning zones. This blend of Market Structure analysis and visual clarity makes it invaluable for traders seeking high-probability entries.
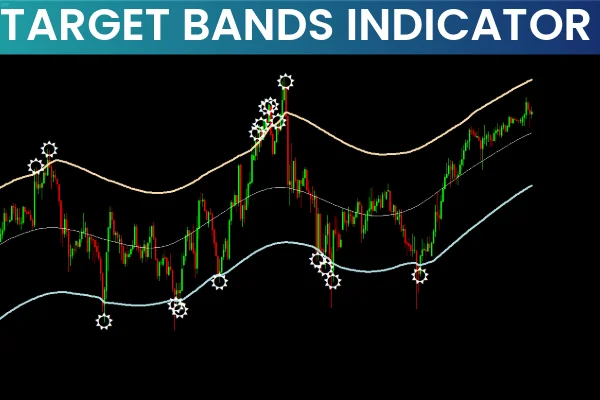
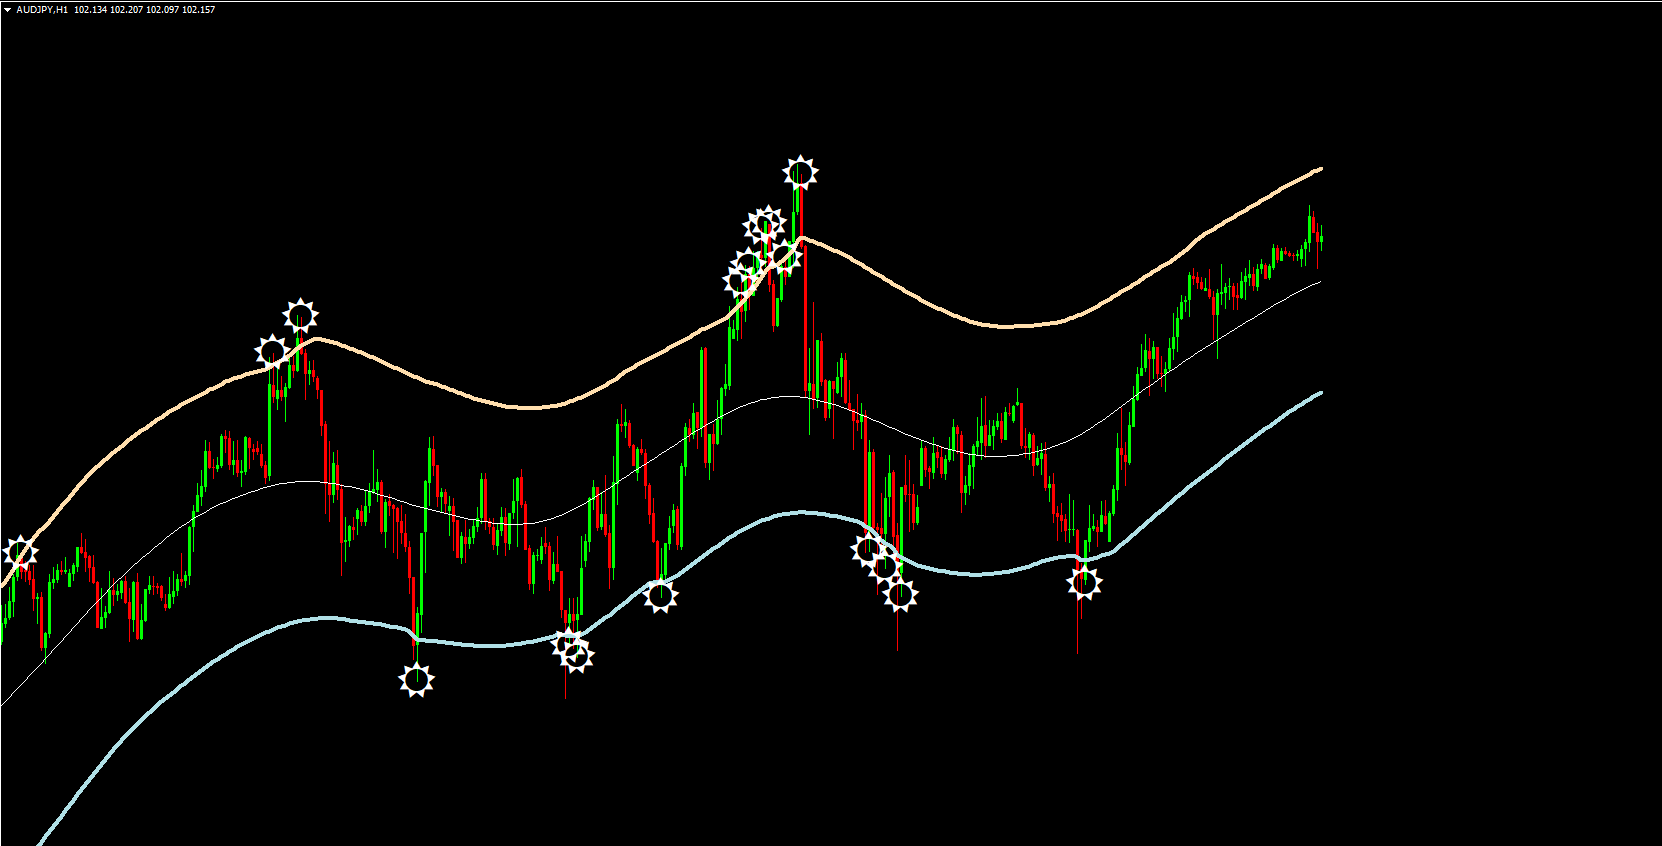
How the Target Bands Indicator Works
The indicator plots two channel-like bands on your MT4 chart:
Upper Band: Represents an overbought or exhaustion zone
Lower Band: Represents an oversold or exhaustion zone
When the price interacts with either band, it signals a potential reversal. The indicator also features buy/sell signal stars:
A star below a candlestick signals a potential buy entry
A star above a candlestick signals a potential sell entry
These signals help traders visually confirm market exhaustion and anticipate shifts in momentum.
Why the Bands Are Effective
The bands work similarly to volatility and trend indicators commonly used in algorithmic trading. By using a fixed 55-period look-back, the indicator adapts to price movements without being overly reactive. This balance prevents excessive noise while still catching early reversal signs—ideal for fast-moving markets.
Best Conditions and Timeframes for Trading
Great for Scalpers and Day Traders
The Target Bands indicator is widely used by scalpers, day traders, and intraday traders because it responds quickly to market swings. It excels on pairs like EURUSD, GBPUSD, and XAUUSD, especially on timeframes such as M15, M30, and H1.
Price Tends to Return to the Bands After Breakouts
One of the most powerful concepts behind this tool is “band retraction.” When price breaks outside the channel, it often returns back toward the bands. This creates high-probability reversal setups—especially when combined with candlestick patterns or structure analysis.
How to Trade With the Target Bands Indicator (Step-by-Step)
The indicator is most effective when paired with Price Action, as shown in the example of EURUSD on the M30 timeframe:
Identify a Breakout from the Bands
When the price breaks out of the lower band and forms multiple wick rejections, it indicates exhaustion. This pattern suggests that sellers are losing strength, and a bullish reversal may be forming.
Wait for the Buy/Sell Star Signal
If the indicator paints a buy star below a candlestick after the breakout, it’s an additional confirmation of a potential upward reversal. The same principle applies to the upper band for sell signals.
Confirm With Price Action Patterns
A bullish engulfing pattern, pin bar, or other reversal candle confirms the setup and increases accuracy. Once confirmed, you can confidently open the position.
Manage the Trade Wisely
Use:
Nearby support/resistance levels
Recent swing highs/lows
Band midpoint or opposite side of the channel
This structured approach boosts win rate while reducing risk.
Conclusion
The Target Bands indicator for MT4 is a highly sensitive and effective tool for identifying trend reversals and trading exhaustion zones. Its combination of channels, breakout detection, and buy/sell star signals makes it ideal for intraday strategies and algorithmic-style decision-making. Download the indicator today and explore more powerful MT4 tools at IndicatorForest.com.
FAQ
64 Downloads
Published:
Nov 27, 2025 22:41 PM
Category: