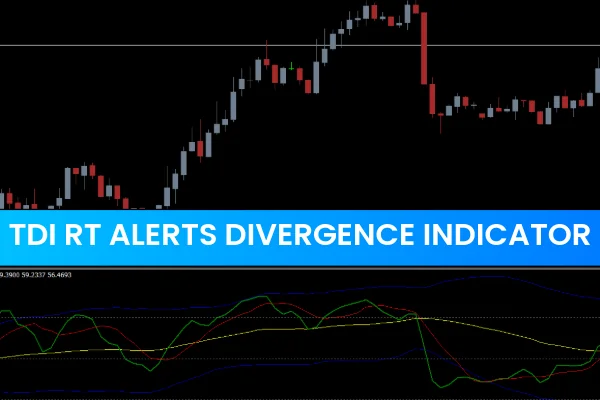
The Traders Dynamic Index (TDI) RT Alerts Divergence indicator is a comprehensive forex trading tool that combines multiple indicators into a single system. It allows traders to monitor the market from several perspectives, including trend direction, Trend Strength, and market volatility.
Developed by Dean Malone in 2005, the TDI indicator was a pioneer in trend analysis. It integrates RSI, moving averages, and Bollinger Bands, providing a holistic view of market conditions. This unique fusion makes the TDI RT Alerts Divergence an effective standalone trading system while also serving as a powerful tool to complement existing strategies.
Components of the TDI Indicator
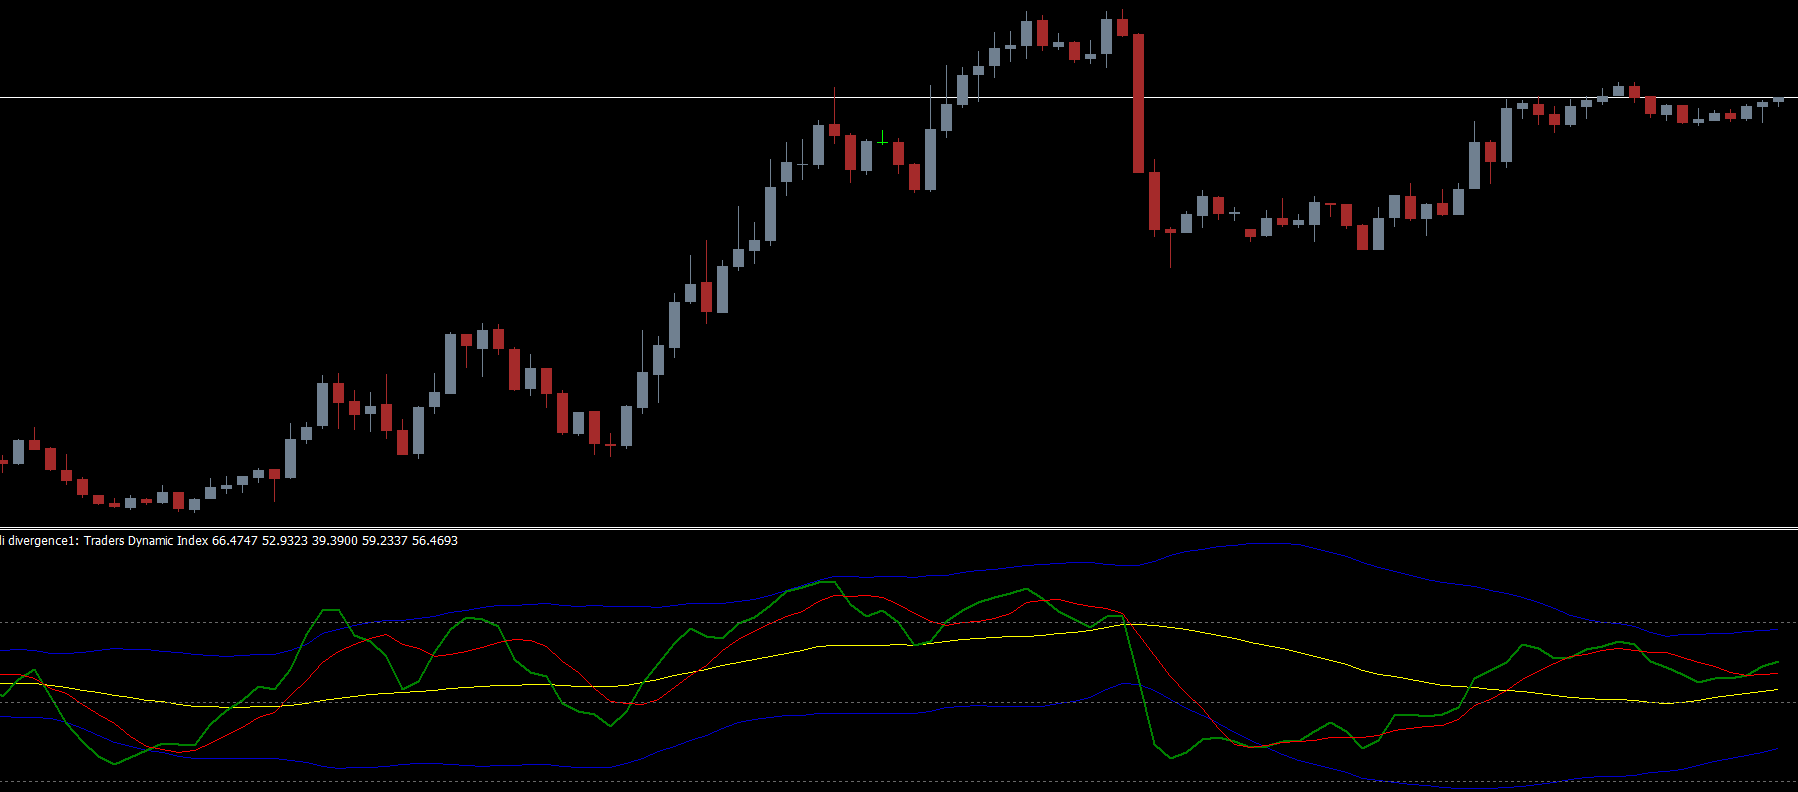
The TDI indicator consists of five primary lines, each with a specific role:
Green Line: Shows market sentiment, similar to the RSI, reflecting short-term price reactions.
Red Line: A crossover of the green line, used for market entry and exit signals.
Yellow Line: Represents the overall market trend and connects other components for tradability.
Blue Lines: Two Bollinger-like bands above and below the price, indicating market volatility.
By analyzing the interaction of these lines, traders can identify entry points, exit points, and potential trend reversals with higher confidence.
How to Use the TDI Indicator
The TDI RT Alerts Divergence indicator can be used to determine short-term and long-term trends as well as market strength and volatility:
Trend Analysis:
Green line above red line → short-term bullish trend
Green line below red line → short-term bearish trend
Yellow line indicates long-term trend direction
Market Strength:
Steep slope of the green line → strong market activity
Horizontal green line → weak or stagnant market
Volatility Measurement:
Widening blue bands → increasing volatility
Narrowing blue bands → decreasing volatility, possibly before major news releases
Traders should avoid trading when the bands are narrow, as low volatility periods can produce false signals.
TDI Trading Strategy
The TDI RT Alerts Divergence indicator works best on H1 or higher timeframes. Below are recommended setups for buy and sell trades:
TDI Buy Setup
Green line above the yellow and red lines
Wait for a bullish candlestick pattern
Place a stop-loss near the recent swing low
Exit when the green line falls below the red line
TDI Sell Setup
Red line above the yellow and green lines
Wait for a bearish candlestick pattern
Place a stop-loss near the recent swing high
Exit when the red line falls below the green line
Using the TDI indicator in combination with Price Action, support/resistance levels, or other oscillators can improve trade accuracy and minimize risk.
Advantages of the TDI RT Alerts Divergence Indicator
Consolidates trend, momentum, and volatility in one indicator
Helps detect trend reversals and continuation patterns
Provides clear buy/sell setups with visual signals
Suitable for both short-term and medium-term trading
Ideal for major forex pairs and other assets with stable volatility
Conclusion
The Traders Dynamic Index (TDI) RT Alerts Divergence indicator is a versatile and reliable tool for forex traders. It simplifies trend detection, provides insight into market volatility, and offers actionable signals for entries and exits. Traders are encouraged to use it on major currency pairs and combine it with other technical analysis tools for best results.
The TDI RT Alerts Divergence indicator is available for free download at IndicatorForest.com. Enhance your trading strategy today with this multi-functional indicator.
FAQ
1 Download
Last Update:
Nov 26, 2025 01:23 AM
Published:
Nov 26, 2025 01:22 AM
Category: