Unlock Market Momentum with the TDI TR Colorful Indicator
Navigating the complexities of the Forex market requires a tool that can decode sentiment, volatility, and Trend Strength simultaneously. The TDI TR Colorful Indicator (Traders Dynamic Index) is a comprehensive "all-in-one" solution designed to give traders a definitive edge. By blending Relative Strength Index (RSI), Moving Averages, and Bollinger Bands into a single cohesive window, this indicator eliminates the need for a cluttered workspace while providing high-probability trade setups.
What is the TDI TR Colorful Indicator?
The TDI is a legendary hybrid indicator that tracks the market’s "heartbeat." It measures price sentiment compared to market volatility. The "TR Colorful" version enhances this experience by using distinct color palettes and optimized visual smoothing, making it easier to spot trend reversals and continuation patterns at a glance.
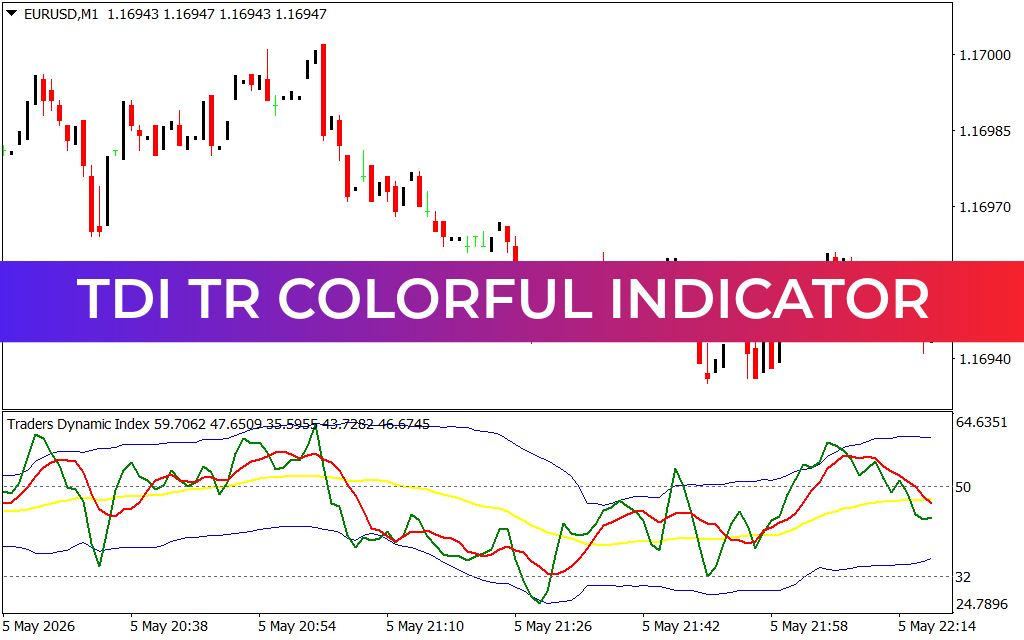
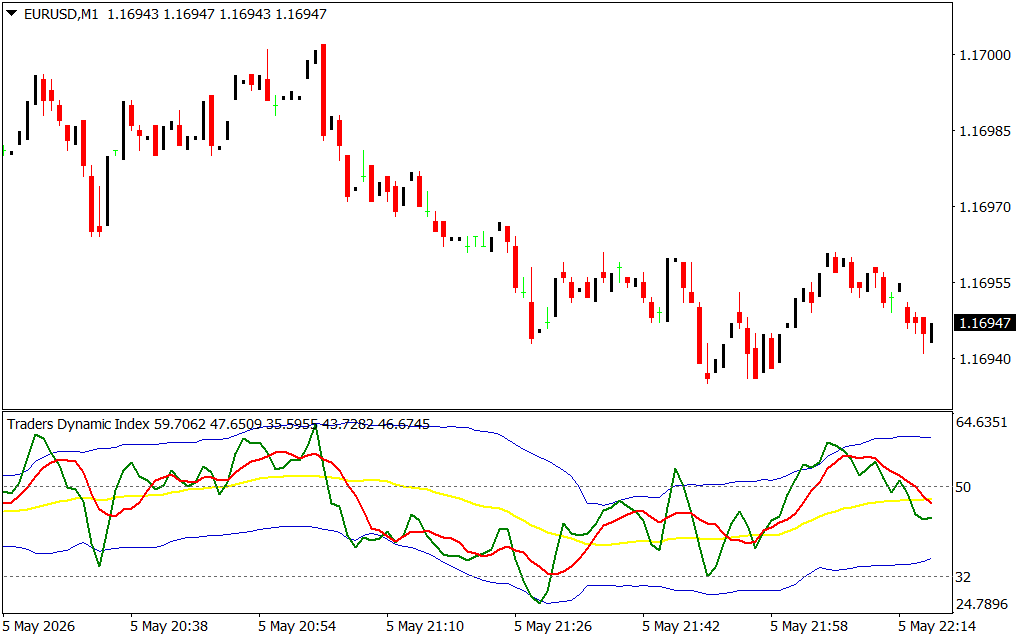
As seen in the technical analysis provided for the EURUSD, M1 timeframe, the indicator consists of several critical components:
- The Green Line (RSI Price Line): Shows the current market sentiment and Price Action.
- The Red Line (Trade Signal Line): A moving average of the green line, used to identify entry and exit points.
- The Blue Lines (Volatility Bands): Based on Bollinger Bands, these show market volatility and potential overbought/oversold levels.
- The Yellow Line (Market Base Line): Represents the overall market trend. When the green line is above the yellow, the bias is bullish.
Why Every Trader Needs the TDI TR Colorful
The primary advantage of the TDI TR Colorful is its ability to filter out market noise. In the fast-paced EURUSD, M1 environment, small price fluctuations can often lead to "fakeouts." The TDI prevents this by requiring multiple conditions—sentiment, volatility, and trend—to align before a signal is generated.
Professional traders value the TDI for its versatility. It is not just a trend-following tool; it is exceptional at identifying Divergence. When price makes a new high but the green line on the TDI fails to follow, a reversal is often imminent. This predictive power allows traders to exit losing positions early or enter new trends right as they begin.
Trading Strategies with TDI TR Colorful
One of the most popular strategies is the "Shark Fin" pattern. This occurs when the green line spikes outside the blue volatility bands and quickly snaps back inside. This indicates an exhausted trend and an extreme overbought or oversold condition.
Another reliable setup is the Crossover. When the green line crosses above the red line while both are above the yellow Market Base Line, it signals a high-probability "Buy." Conversely, a cross below the red line while below the yellow line signals a "Sell." These visual cues are sharpened in the Colorful version, ensuring you never miss a beat in the market.
Conclusion
The TDI TR Colorful Indicator is an essential upgrade for any MetaTrader platform. It transforms raw data into actionable intelligence, allowing you to trade with the confidence of a professional. Whether you are Scalping the M1 timeframe or swing trading the daily charts, the TDI TR Colorful provides the clarity needed to master the markets.ying profitable trades with ease.
3 Downloads
Last Update:
May 06, 2026 01:19 AM
Published:
Jan 27, 2026 13:27 PM
Category: