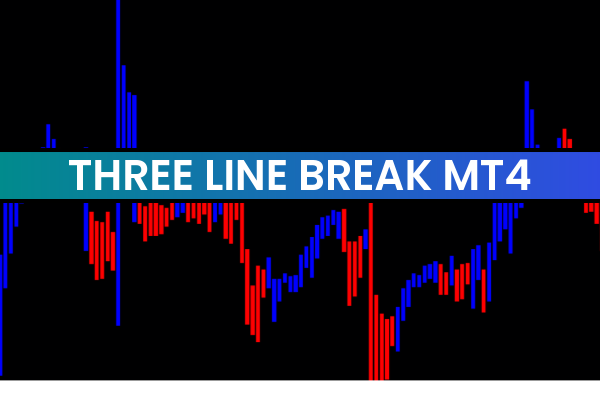
The Three Line Break Indicator is a useful and popular forex trading tool designed for the MetaTrader 4 (MT4) platform. This free indicator helps traders identify trends and potential entry points by focusing purely on price movements rather than time-based intervals. Because of this unique approach, it offers a clear view of market direction and Trend Strength.
Unlike traditional candlestick or bar charts that rely on fixed timeframes, the Three Line Break Indicator builds its structure only when price moves significantly. This makes it especially helpful for traders who want to reduce market noise and focus on meaningful Price Action.
How the Three Line Break Indicator Works
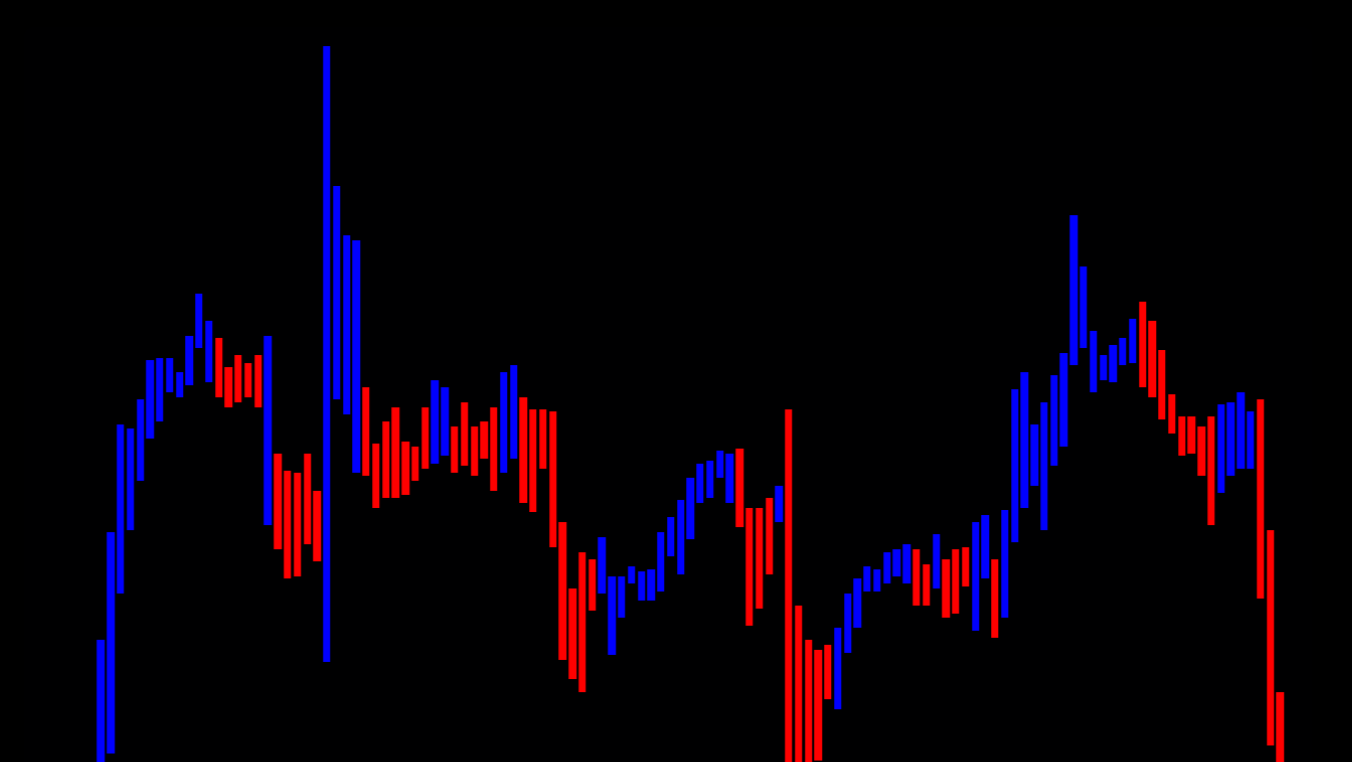
The Three Line Break Indicator works by plotting lines instead of candles, based solely on price movement. A new line is drawn only when price breaks above or below previous levels. Time plays no role in the formation of these lines.
If price continues in the same direction, new lines are added in the same color. A reversal occurs only when price breaks beyond the high or low of the previous three lines, signaling a potential trend change. This method makes trend identification simple and visually clear.
Key Features of Three Line Break Indicator
Price-Based Trend Identification
Because the indicator ignores time, it focuses entirely on price behavior. This helps traders spot real trends without being distracted by minor price fluctuations.
Clear Trend and Reversal Signals
Consecutive lines in the same color indicate a strong trend, while a color change signals a possible reversal. This makes market direction easy to understand even for beginners.
Reduced Market Noise
By filtering out insignificant price movements, the Three Line Break Indicator provides a smoother and more reliable view of market trends.
How to Use Three Line Break Indicator
Installation and Setup
Download the Three Line Break Indicator for MT4
Install it in the MetaTrader 4 indicators folder
Attach the indicator to any currency pair
Choose suitable settings based on your trading style
Trading Signals and Interpretation
Uptrend: Multiple consecutive bullish lines indicate a strong upward trend
Downtrend: Multiple bearish lines signal a strong downward trend
Trend Reversal: A color change after a break of previous levels may indicate a reversal
Trading Example
On a EUR/USD chart, the Three Line Break Indicator shows several consecutive bullish lines, confirming an uptrend. Traders may look for buy opportunities during pullbacks. When the indicator later forms a bearish line after breaking previous support, it warns of a possible trend reversal and potential sell opportunity.
Advantages of Three Line Break Indicator
Focuses purely on price action
Clearly identifies trends and reversals
Reduces false signals caused by market noise
Suitable for trend-following strategies
Free to download and fully compatible with MT4
By incorporating the Three Line Break Indicator into their trading strategy, traders can improve market timing and make more confident trading decisions.
Conclusion
The Three Line Break Indicator MT4 is a powerful forex trading tool for identifying trends and potential market reversals using price-based analysis. Its simple design and noise-reducing approach make it suitable for traders of all experience levels. Visit IndicatorForest.com to download the Three Line Break Indicator for free and enhance your MT4 trading strategy today.
FAQ
Three Line Break displays price action using a line break chart method that filters out minor price movements. It shows only significant price changes, making trend identification clearer.
Line breaks occur only when price moves significantly beyond previous highs or lows. This filtering removes noise, shows only important price movements, and makes trend changes more visible.
Enter trades when line breaks occur in trend direction, trade reversals when line break direction changes, use line breaks to identify trend changes, and use break levels for stop-loss placement.
Line break charts filter out market noise, show only significant price movements, make trend identification clearer, and provide a cleaner view of price action than traditional candlestick charts.
Combine with trend indicators for confirmation, use with momentum oscillators, integrate with support/resistance analysis, and combine line break signals with other technical analysis methods.
1 Download
Published:
Dec 16, 2025 13:46 PM
Category: