Trading Pure Structure: The Three Line Break Chart SR Indicator
Standard candlestick charts pack a massive amount of market information into every single bar, capturing the open, high, low, and close within fixed intervals of time. While this time-based tracking is useful for standard technical applications, it introduces a significant amount of intraday market noise, choppy ranges, and minor price spikes that can obscure major structural shifts. The Three Line Break Chart SR Indicator solves this structural dilemma. By filtering out the passage of time entirely and focusing exclusively on sequential price movements, this powerful institutional utility charts pure trend reversals and anchors high-probability Support And Resistance (SR) baselines.
Here is an analysis of how this technical indicator processes market data and how to use its horizontal boundaries to refine your execution edge.
The Pure Price Logic of Three Line Break Models
Originating in Japan, Three Line Break (TLB) charting is a vertical blocking mechanism that only prints new data when the market forces a decisive breakout. Unlike standard charts that print a new candle every 30 minutes regardless of volatility, a TLB system requires price to break past the highs or lows of a specified number of consecutive previous blocks—most commonly three—before a reversal block can manifest.
When integrated into an MT4 or MT5 terminal as an automated support and resistance overlay, the engine takes the critical inflection points of these underlying asset breaks and extends them horizontally into real-time trading views. This mathematical framework strips away minor algorithmic sweeps, allowing you to focus purely on major structural blocks where institutional capital has officially established a new market regime.
Analyzing Reversals and Key Horizontals on the Chart
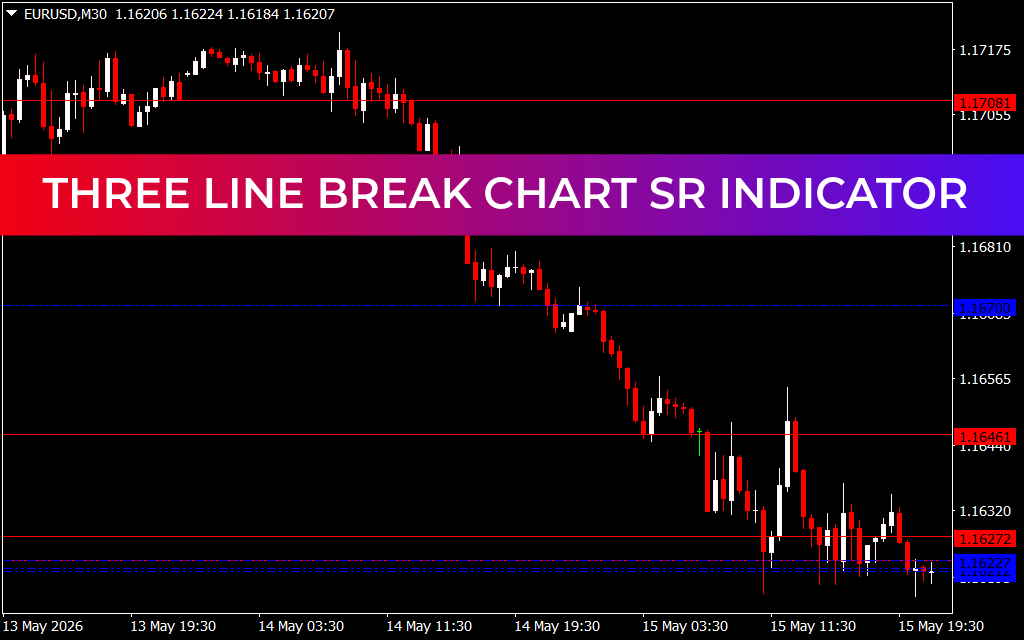
As demonstrated on the EUR/USD M30 chart, the indicator simplifies complex intraday trends by plotting clean, definitive support and resistance levels right across your main terminal window:
- The Bearish Trend Realization: As the currency pair breaks key structural lows, the market drops into a clean, uninhibited markdown phase. Because time is filtered out, the indicator prevents you from prematurely buying minor intraday pullbacks that lack structural validation.
- The Resistance Ceilings (Solid Red Lines): The indicator anchors distinct horizontal red lines across key historical flip zones, such as $1.1708$ and $1.1646$. These represent major distribution zones where sellers previously broke a multi-line structural low, marking optimal areas to look for fresh short continuations.
- The Support Floors (Dashed and Solid Blue Lines): At the absolute bottom of the liquidation cascade, near the $1.1622$ mark, the indicator plots concentrated blue support lines. When price clusters tightly around these lines without achieving a fresh structural breakdown, it alerts day traders that an influx of buying liquidity is actively stepping in to defend the floor.
Strategic Integration for Intraday Terminals
To maximize the mathematical edge of the Three Line Break Chart SR Indicator, implement these structured trading methodologies:
- Clean Support/Resistance Pullbacks: Instead of chasing a fast breakout, wait for price to pull back and retest an established horizontal red resistance line or blue support line. Look for a traditional candlestick rejection pattern at these exact levels to secure a highly precise entry.
- Objective Breakout Confirmation: When price prints a decisive 30-minute candle that closes completely past a key red resistance or blue support level, it confirms an authentic structural breakout, clearing the path to trade the fresh extension.
- Tight Risk Parameters: Use these horizontal markers to place logical stop-loss orders. When entering a short position near a red resistance line, place your defensive stop just a few pips above the level, ensuring a highly favorable risk-to-reward ratio.
1 Download
Last Update:
May 17, 2026 02:09 AM
Published:
Jan 20, 2026 22:43 PM
Category: