Streamlining Market Structure: The Three Line Break Chart SR Indicator MT4
Financial charts pack an immense amount of variable data into regular trading screens. Standard time-based candlesticks plot market actions across strict intervals, which frequently exposes retail traders to a massive influx of market noise, deceptive pin bars, and minor price spikes that cloud true underlying value. For systematic swing traders and scalpers, isolating authentic trend changes requires filtering out the passage of time entirely. The Three Line Break Chart SR Indicator MT4 solves this structural problem by utilizing classic price-break rules to map clean, institutional Support And Resistance (SR) baselines.
Here is an in-depth breakdown of how this analytical indicator functions and how to utilize its horizontal boundaries to refine your market execution.
The Pure Price Engine of Three Line Break Models
Developed centuries ago in Japan, Three Line Break (TLB) charting relies exclusively on sequential closing prices to formulate its data steps. Unlike traditional layouts that force a new bar to print every 15 or 30 minutes regardless of actual volume, a TLB model remains perfectly frozen until the market proves it has the directional liquidity to establish a structural expansion.
To print a reversal block, the closing price must exceed the high or low extremes of a designated number of preceding blocks—most commonly set to a three-line default. When this structural shift occurs, it confirms that institutional capital has successfully overwhelmed the previous order flow regime. This automated indicator takes the critical swing points of these underlying asset breaks and extends them as real-time horizontal support and resistance zones across your live MT4 workspace.
Navigating Key Horizontals and Breakout Zones
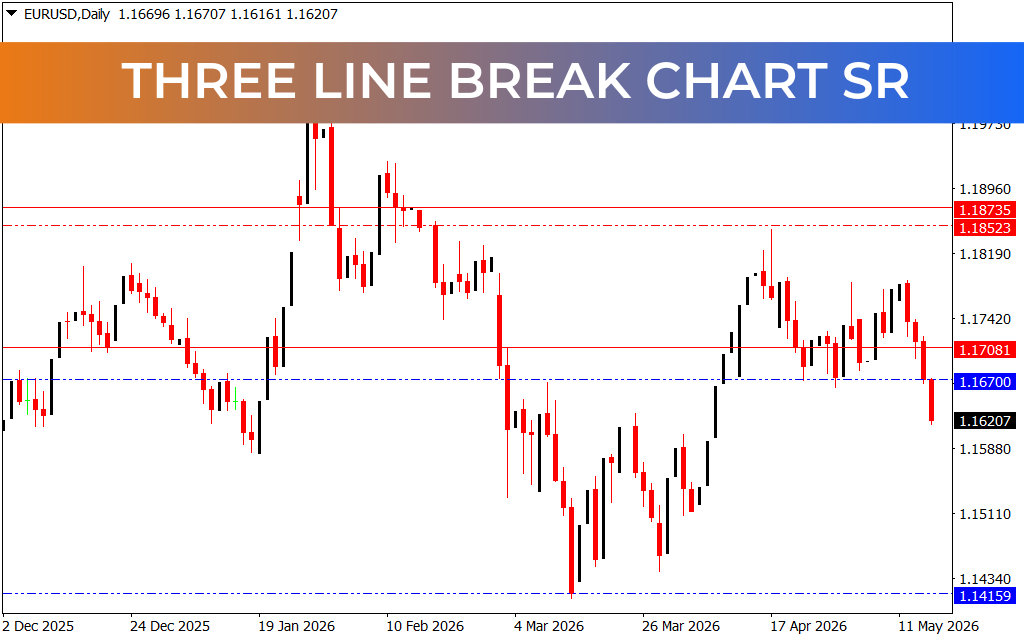
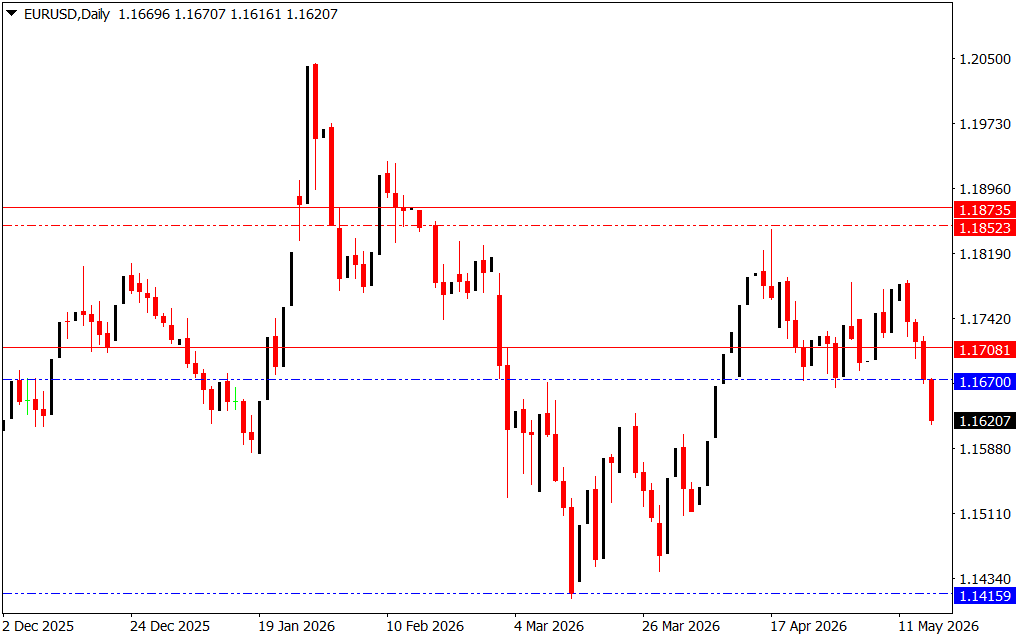
As demonstrated on the EUR/USD M30 chart, the indicator replaces standard chart clutter with clear, scannable horizontal lines to track active distribution and accumulation phases:
- The Resistance Ceilings (Solid Red Lines): The indicator automatically extends distinct horizontal red boundaries across historical flip zones, such as the $1.1708$ and $1.1646$ marks. These levels represent historic block points where sellers previously broke multi-line structural lows, providing day traders with clear overhead supply zones to look for short entries.
- The Support Floors (Dashed and Solid Blue Lines): At the base of major market liquidations, near the $1.1622$ level, the indicator anchors concentrated blue lines. When Price Action compresses tightly against these lines without achieving a fresh multi-line breakdown, it signals that strong institutional accumulation is stepping in to protect the floor.
Because the indicator ignores temporal noise, these support and resistance zones carry much higher structural integrity than levels drawn manually on regular candlestick charts.
Professional Strategies for Execution Terminals
To maximize the performance of the Three Line Break Chart SR system on your MetaTrader 4 terminal, implement these structured trading methodologies:
- Strategic Retest Execution: Avoid chasing fast momentum candles. Instead, wait for price to break a key horizontal line, and then execute your entry when a minor pullback retests the red resistance line or blue support line as a validated flip zone.
- Objective Stop Placement: Use these horizontal levels to set strict, rule-based risk parameters. When trading a short continuation off a red resistance line, position your defensive stop-loss order just a few pips above the barrier to maximize your risk-to-reward ratio.
- Multi-Timeframe Regime Filters: Check your daily or 4-hour charts to establish the dominant institutional market direction. Only take lower-timeframe execution setups that align precisely with the major horizontal boundaries plotted on your macro-structural views.
8 Downloads
Last Update:
May 17, 2026 02:11 AM
Published:
Jan 20, 2026 22:41 PM
Category: