Decoding Multi-Timeframe Velocity: Maximizing Trend Precision with the Time Frame 2X Velocity NMC Indicator
In modern financial markets, trading in a single-timeframe vacuum is a primary reason retail day traders fail. A lower-timeframe entry can look incredibly bullish, only to crash instantly because it ran directly into a major higher-timeframe resistance level. The Time Frame 2X Velocity NMC Indicator for MT4/MT5 resolves this systemic challenge. By evaluating four distinct architectural timeframes inside a single sub-window grid, this sophisticated technical tool tracks structural momentum velocity simultaneously, helping traders spot high-confluence trend breakouts and avoid costly false counter-trend signals.
Download Time Frame 2X Velocity NMC for free. Track multi-timeframe momentum simultaneously from one screen to spot high-confluence trend reversals.
Navigating Multi-Timeframe Alignment on the EUR/USD H1 Chart
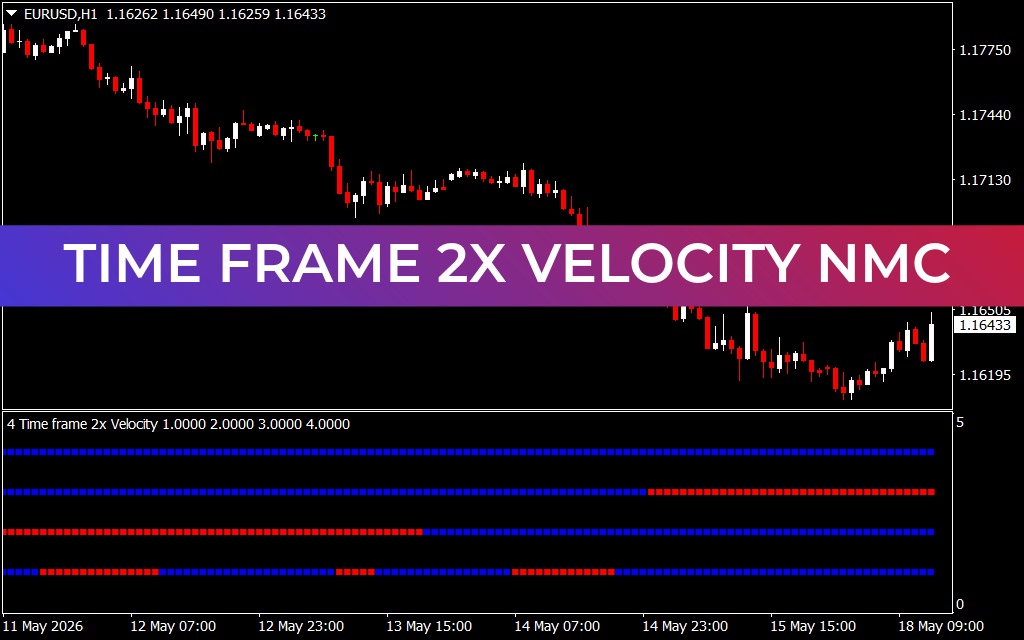
The provided EUR/USD 1-hour (H1) chart showcases how the Time Frame 2X Velocity NMC engine acts as a definitive visual dashboard for global order flow. Located beneath the primary price field, the indicator translates multi-dimensional mathematical trend vectors into a clean grid of four stacked, horizontal rows composed of blue and red structural blocks.
During the initial phase of the multi-day trading session, the asset initiated a sharp distribution markdown from the 1.17750 liquidity pool. For trend followers, trying to time an entry during a massive cascade can induce anxiety. However, a quick glance at the indicator sub-window provides absolute clarity. As the bearish momentum accelerated, all four horizontal velocity matrices turned a synchronized, solid red.
This universal correlation across multiple timeframes signals that systemic, institutional selling pressure is driving the market. It gives day traders the conviction to maintain short positions and filter out minor retail pullbacks until the price hits macro support near the 1.16195 area.
Strategic Execution at the Birth of Trend Rotations
The true tactical edge of the Time Frame 2X Velocity NMC indicator unfolds when a market reaches structural exhaustion and undergoes a trend rotation. Following a prolonged accumulation phase between May 15 and May 18, the asset initiated a massive upward expansion leg back toward the 1.16505 level.
Notice how the horizontal bands in the sub-window react during this structural transition. Rather than lagging behind Price Action like traditional moving averages, the lower rows—representing lower, more sensitive timeframes—flip from red to solid blue well before the higher-timeframe rows react. This staggered transition maps out the exact birth of an intraday trend rotation.
Currently trading near 1.16433, the indicator shows a dominant blue block presence across the lower matrices, proving that shorter-term momentum is aggressively building a bullish foundation. Traders can use this multi-timeframe grid to place tight, optimized stop-losses just beneath localized swing lows. By shifting your technical analysis from lagging on-chart lines to real-time multi-timeframe velocity tracking, you eliminate subjectivity and execute trades with institutional-grade precision.
2 Downloads
Last Update:
May 18, 2026 16:48 PM
Published:
Jan 19, 2026 21:41 PM
Category: