Mastering Mean Reversion with TMA Centered Bands for MT4/MT5
In the quest for the perfect trend-following and reversal tool, many traders struggle with the inherent "lag" found in standard Bollinger Bands or Envelopes. The TMA Centered Bands indicator provides a more elegant solution by utilizing a Triangular Moving Average (TMA) to smooth price data and project a balanced channel around Price Action. Unlike traditional moving averages that simply follow price, the TMA Centered Bands focus on the "equilibrium" of the market, making it one of the most reliable tools for identifying when a trend has reached its exhaustion point.
The Power of the Triangular Moving Average
The core of this indicator is the TMA, which is essentially a double-smoothed simple moving average. This unique calculation gives more weight to the middle of the data series, resulting in a much smoother line that is less susceptible to market noise and "fakeouts."
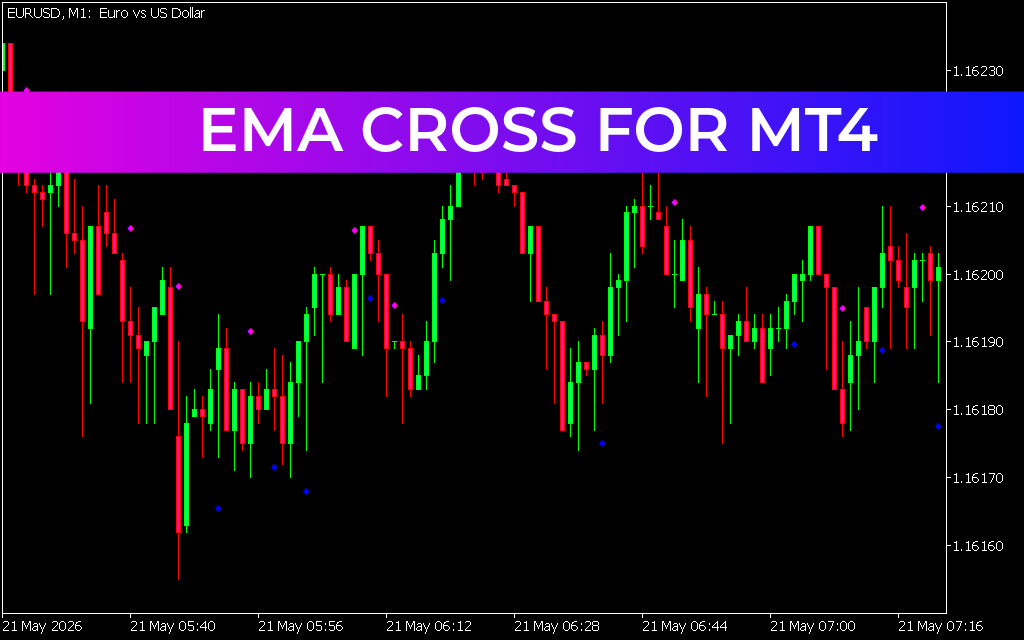
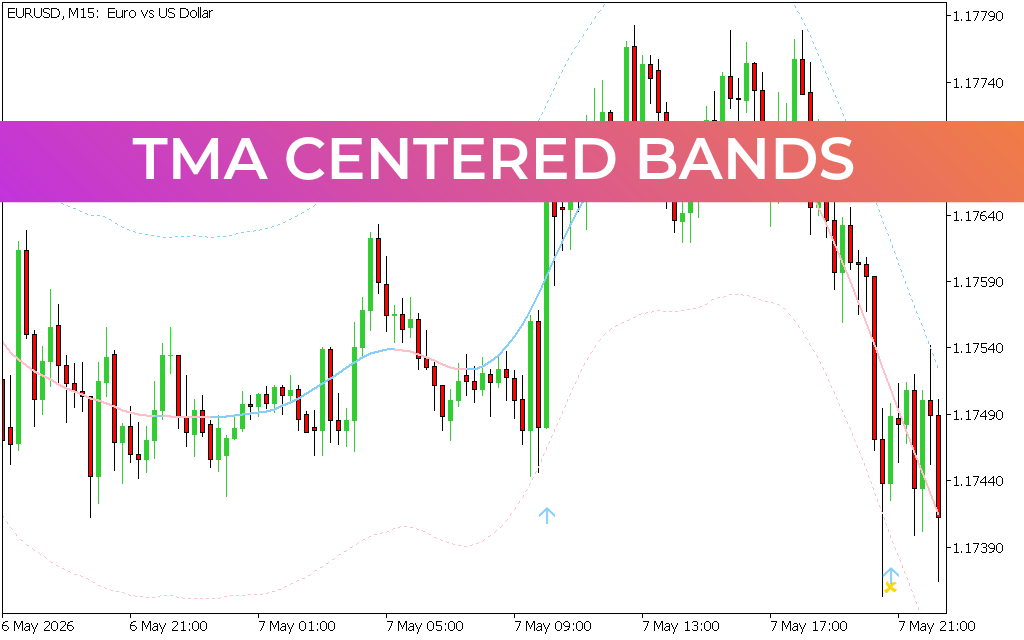
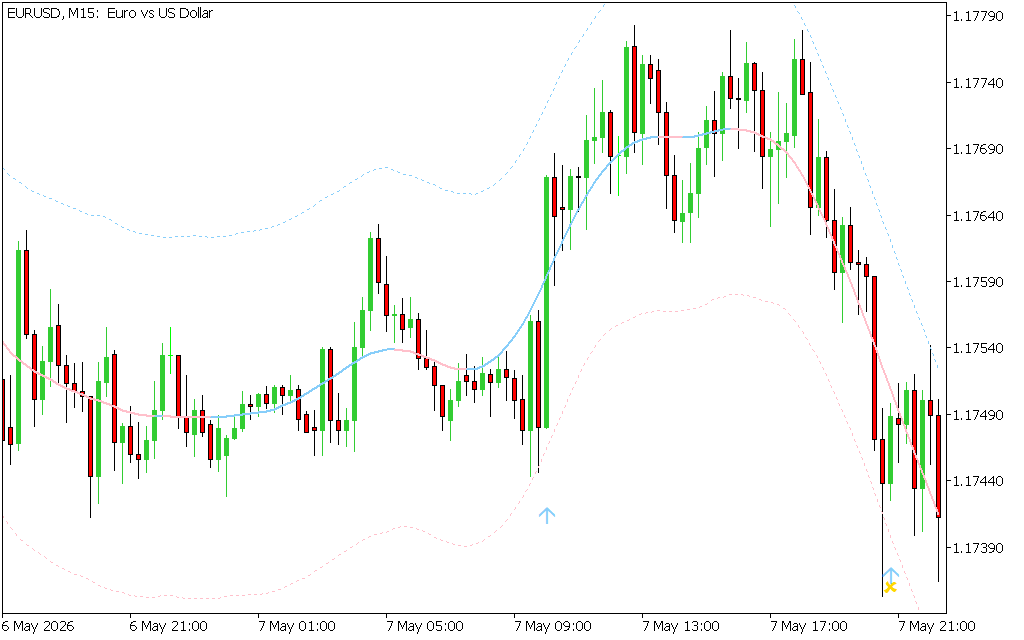
As seen in the EURUSD chart, the indicator creates a three-line structure:
- The Upper Band (Blue dotted): Represents the extreme overbought boundary where price is statistically likely to retraced.
- The Lower Band (Red dotted): Represents the extreme oversold boundary, signaling potential buying opportunities.
- The Center Line (Solid Blue/Red): This is the "fair value" line. It changes color (Blue for bullish, Red for bearish) to indicate the current directional bias of the market.
Key Benefits for Technical Analysis
- Precise Volatility Mapping: The bands dynamically expand and contract based on market volatility. This allows traders to visualize the "breathing" of the market and stay out of low-probability, range-bound environments.
- Reliable Reversal Signals: When price pierces or touches the outer bands and is accompanied by a reversal candlestick pattern, it provides a high-confluence signal that the market is ready to return to its mean (the center line).
- Dynamic Trend Filtering: By observing the slope and color of the center line, traders can easily filter out trades that go against the prevailing momentum.
- Intraday Accuracy: On timeframes like M15 and H1, the TMA Centered Bands excel at catching session highs and lows, making them a favorite for day traders and scalpers.
Strategic Trading Application
The most effective way to utilize TMA Centered Bands is as a "boundary" tool. When price moves outside the bands, it is in a state of imbalance. Sophisticated traders look for price to close back inside the bands as a signal to enter a trade targeting the center line. Additionally, the indicator often includes "arrows" (as seen in the image) to highlight specific mathematical cross-points, providing immediate visual confirmation for entries.
Conclusion
The TMA Centered Bands indicator is more than just a price channel; it is a mathematical map of market sentiment. By focusing on centered smoothing rather than lagging averages, it gives you a clearer view of where price is going—and where it has gone too far.
3 Downloads
Last Update:
May 09, 2026 01:25 AM
Published:
Jan 25, 2026 13:36 PM
Category: