TMA MACD Indicator

TMA MACD Indicator
Free

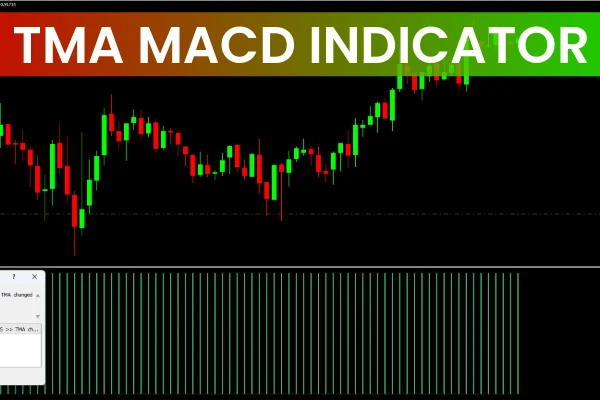
The TMA MACD indicator for MT4 is a powerful tool that combines Triangular Moving Average (TMA) smoothing with the proven Moving Average Convergence and Divergence (MACD) calculation. Traders use this hybrid indicator to reduce lag, improve accuracy, and detect trend changes earlier. By calculating MACD values using the next higher timeframe, this system gives clearer, more stable signals that align with the dominant market direction. Whether you're new to trading or an experienced algorithmic trader, this tool helps you stay ahead of fast-moving markets.

 How the TMA MACD Indicator Improves Trading Decisions

The strength of the indicator lies in its multi-timeframe MACD calculation. Instead of relying solely on the current chart’s timeframe, the indicator analyzes the next higher one—for example, using H1 data while viewing the M30 chart.

 Benefits of Higher Timeframe MACD Confirmation

Filters out noise from lower timeframes

Displays more reliable arrows and histogram color changes

Helps traders align entries with the long-term trend

Reduces false signals caused by short-term volatility

When the histogram changes color, traders receive immediate buy or sell signals, making trend identification faster and visually intuitive.

 Trading Crossovers with the TMA MACD Indicator for MT4

A standout feature is the enhanced crossover logic. Instead of relying on the traditional zero-line MACD cross, the TMA MACD indicator uses custom Hot Levels that reflect instrument volatility.


They filter out small, insignificant price movements

They adapt better to currency-pair volatility

They help avoid whipsaws during flat or choppy markets

Once MACD crosses above a Hot Level, the market is considered bullish. A drop below indicates bearish conditions. The indicator then plots arrows directly on the chart, giving clear buy/sell notifications at the right moments.

Limitations Traders Should Consider

Although powerful, the TMA MACD indicator for MT4 has a few constraints:

Performance decreases in ranging or sideways markets

Hot Levels must be custom-calculated for each pair

Traders cannot reuse the same level for different instruments

It is best used in conjunction with Price Action or support/resistance

Testing Hot Levels on historical data is strongly recommended, especially for algorithmic trading or automated systems.

Final Thoughts – Why Traders Choose the TMA MACD Indicator

By reducing moving-average lag and enhancing MACD calculations, the TMA MACD indicator for MT4 helps traders capture cleaner trends and make more accurate decisions. It is ideal for day traders, swing traders, and those using MetaTrader for algorithmic trading.
For more tools, expert indicators, and trading resources, visit IndicatorForest.com today.

FAQ

A powerful tool for MT4 that combines Triangular Moving Average (TMA) smoothing with proven Moving Average Convergence and Divergence (MACD) calculation used by traders to reduce lag improve accuracy and detect trend changes earlier by calculating MACD values using next higher timeframe this system gives clearer more stable signals that align with dominant market direction suitable for new traders and experienced algorithmic traders helping stay ahead of fast-moving markets.

Strength of indicator lies in its multi-timeframe MACD calculation. Instead of relying solely on current chart timeframe, indicator analyzes next higher one for example using H1 data while viewing M30 chart. Benefits of Higher Timeframe MACD Confirmation include filtering out noise from lower timeframes, displaying more reliable arrows and histogram color changes, helping traders align entries with long-term trend, and reducing false signals caused by short-term volatility. When histogram changes color, traders receive immediate buy or sell signals making trend identification faster and visually intuitive.

Standout feature is enhanced crossover logic. Instead of relying on traditional zero-line MACD cross, TMA MACD indicator uses custom Hot Levels that reflect instrument volatility. They filter out small insignificant price movements, adapt better to currency-pair volatility, and help avoid whipsaws during flat or choppy markets. Once MACD crosses above Hot Level, market is considered bullish. Drop below indicates bearish conditions. Indicator then plots arrows directly on chart giving clear buy/sell notifications at right moments.

Although powerful, indicator has few constraints: performance decreases in ranging or sideways markets, Hot Levels must be custom-calculated for each pair, traders cannot reuse same level for different instruments, and it is best used in conjunction with price action or support/resistance. Testing Hot Levels on historical data is strongly recommended especially for algorithmic trading or automated systems. However, by combining TMA smoothing with MACD calculation, indicator reduces lag and improves accuracy making it valuable tool for trend detection.

Indicator combines Triangular Moving Average (TMA) smoothing with proven MACD calculation. By calculating MACD values using next higher timeframe, this system gives clearer more stable signals that align with dominant market direction. It helps traders reduce lag improve accuracy and detect trend changes earlier making it suitable for both new traders and experienced algorithmic traders helping them stay ahead of fast-moving markets making it powerful tool for enhanced MACD analysis.
1 Download

Published:

Dec 02, 2025 02:01 AM

Category:

We use cookies to personalize your experience. By continuing to visit this website you agree to our use of cookies

GDPR and cookie policy