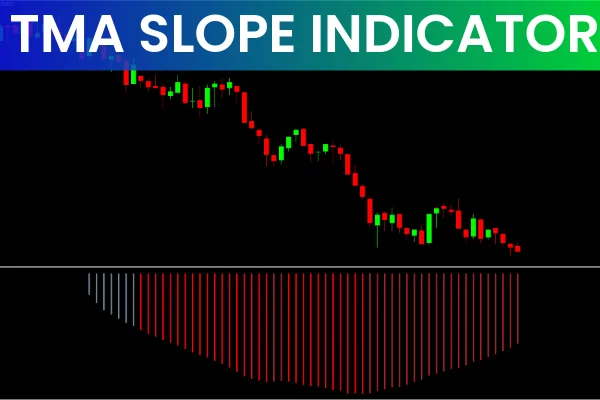
The TMA Slope Indicator for MT4 is a technical tool that provides Forex traders with visual trading signals based on the Triangular Moving Average (TMA). The indicator plots a histogram with three distinct colors—green, red, and gray—indicating bullish, bearish, or neutral market trends. Its simple visual representation makes it suitable for both new and experienced traders looking to follow market trends effectively.
How the TMA Slope Indicator Works
The indicator calculates the slope of the TMA to determine market conditions:
Green Histogram – bullish trend, suggesting a BUY opportunity
Red Histogram – bearish trend, suggesting a SELL opportunity
Gray Histogram – neutral trend, indicating no clear market direction
Traders can quickly assess market momentum and decide when to enter or exit trades. However, it’s important to note that the TMA Slope Indicator may repaint, so additional confirmation tools are recommended.
How to Trade with the TMA Slope Indicator
Bullish Trading Signals
Observe when the histogram turns green, indicating a bullish trend.
Enter a BUY trade when the candle closes confirming the green histogram.
Use other technical tools like support/resistance or trendlines to improve trade accuracy.
Bearish Trading Signals
Observe when the histogram turns red, indicating a bearish trend.
Enter a SELL trade when the candle closes confirming the red histogram.
Consider stop-loss placement above recent swing highs to manage risk.
Neutral Market Conditions
The gray histogram signals low momentum or unclear trends.
Avoid entering trades during neutral conditions, and wait for a clear color change for better accuracy.
Best Practices When Using the TMA Slope Indicator
Combine with other technical indicators for confirmation due to potential repainting.
Use on multiple timeframes to align trend analysis with higher timeframe momentum.
Apply proper risk management with stop-loss and take-profit levels.
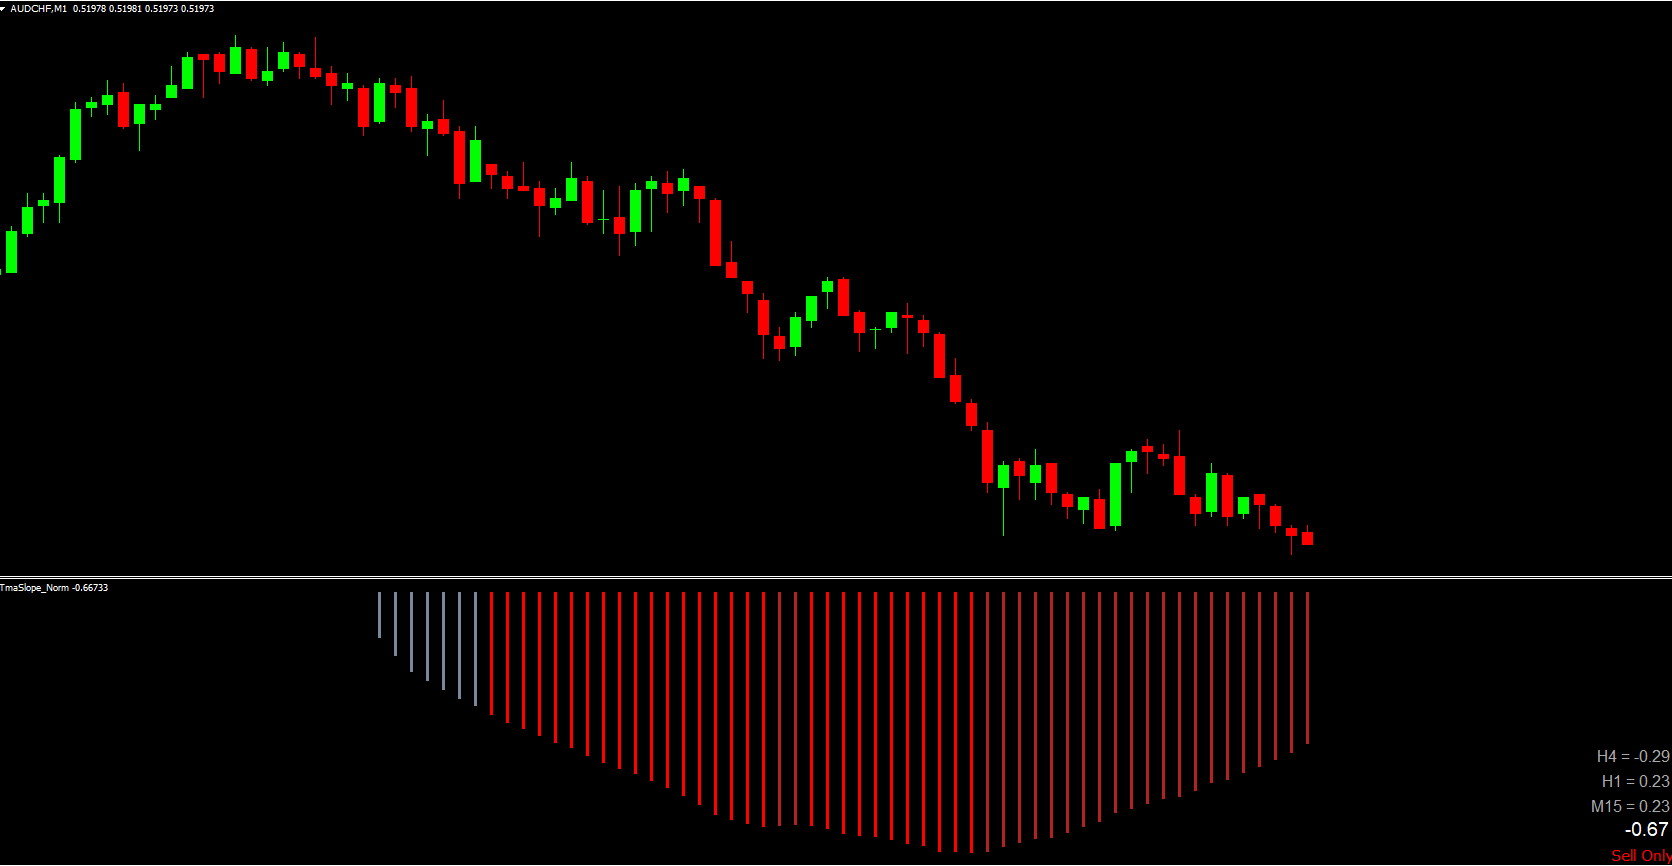
Example of TMA Slope Indicator in Action
On the GBP/USD M15 chart, the histogram clearly shows green bars during bullish phases, red bars during bearish trends, and gray bars during consolidation. This visual approach allows traders to make quick decisions based on Trend Strength and market momentum.
Conclusion
The TMA Slope Indicator for MT4 is a practical tool for Forex traders using the Triangular Moving Average for technical analysis. Its color-coded histogram makes it easy to spot bullish, bearish, and neutral trends. While suitable for both new and advanced traders, combining it with other confirmation tools can increase trading accuracy and reduce risk. Download the TMA Slope Indicator from IndicatorForest.com to enhance your Forex trading strategy.
FAQ
4 Downloads
Published:
Nov 19, 2025 11:18 AM
Category: