Capitalizing on Intra-Day Reversals: Analyzing the EUR/USD M30 Downward Trend
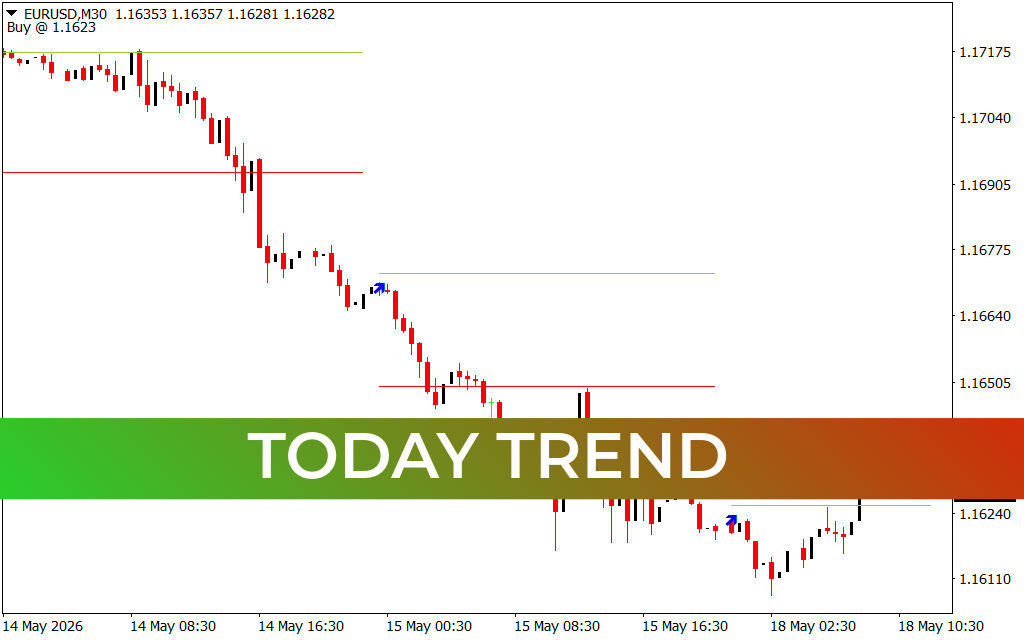
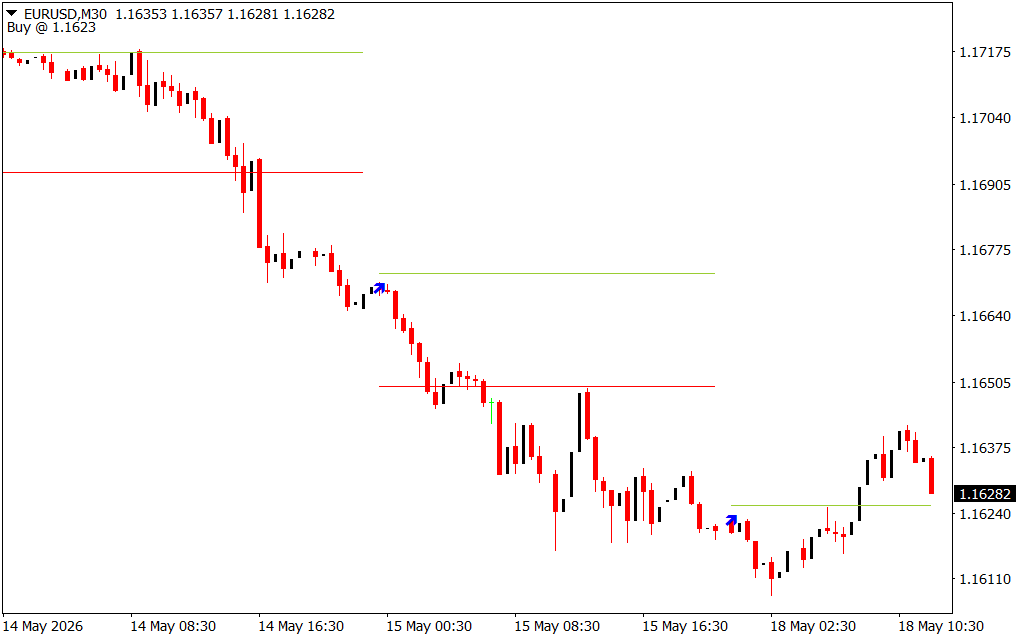
The EUR/USD 30-minute (M30) chart reveals a compelling narrative of a sustained downward trend transitioning into a potential short-term reversal. For forex traders and technical analysts, decoding these Price Action patterns is crucial for identifying high-probability entry points and managing risk effectively. By examining the structural shifts over multi-day sessions, we can uncover actionable insights from this classic bearish-to-bullish transition.
The Anatomy of the Downward Trend
The chart opens with a strong, textbook markdown phase beginning on May 14. Characterized by a sequence of lower highs and lower lows, the sellers clearly maintained absolute control over the market narrative.
During this descent, horizontal Support And Resistance levels—marked vividly by the red and green structural lines—served as critical milestones. In a healthy downtrend, broken support levels frequently flip to become resistance. We see this dynamic play out seamlessly as the price aggressively breaches a key structural floor, consolidates briefly, and then accelerates downward toward the next psychological level. The steepness of the decline on May 14 underscores heavy institutional selling pressure and a lack of immediate buying liquidity.
Signs of Exhaustion and the Shift in Momentum
As the session progressed into May 15, the aggressive momentum began to stall. While the bears managed to push the price down to its absolute low near the 1.16110 region, the price action started printing long lower wicks (shadows). In technical analysis, these wicks are vital clues: they indicate that whenever sellers attempted to push the market lower, buyers stepped in aggressively, absorbing the supply and driving the price back up before the 30-minute candles could close.
This accumulation phase formed a classic double-bottom or rounding bottom structure between the late May 15 session and early May 18. The sudden reduction in downward candle size, coupled with these rejection wicks, signaled that the bearish trend was reaching exhaustion.
The Reversal and the "Buy" Signal
The true shift in Market Structure occurred during the early hours of May 18. The EUR/USD pair broke out of its localized consolidation zone, printing a series of higher lows and higher highs. The price successfully reclaimed the nearest green horizontal resistance line, turning it into a validated support level.
With the current price hovering around 1.16282, a clear structural pivot has been established. The chart features a "Buy @ 1.1623" strategic marker, which perfectly aligns with this newly established support floor. By entering a long position near this zone, traders can exploit a favorable risk-to-reward ratio, placing tight stop-loss orders just beneath the recent swing lows while targeting the overhead red resistance levels left behind during the initial crash.
6 Downloads
Last Update:
May 18, 2026 15:59 PM
Published:
Jan 20, 2026 15:48 PM
Category: