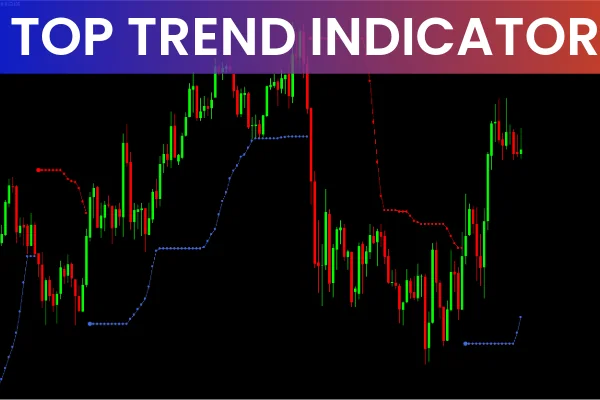
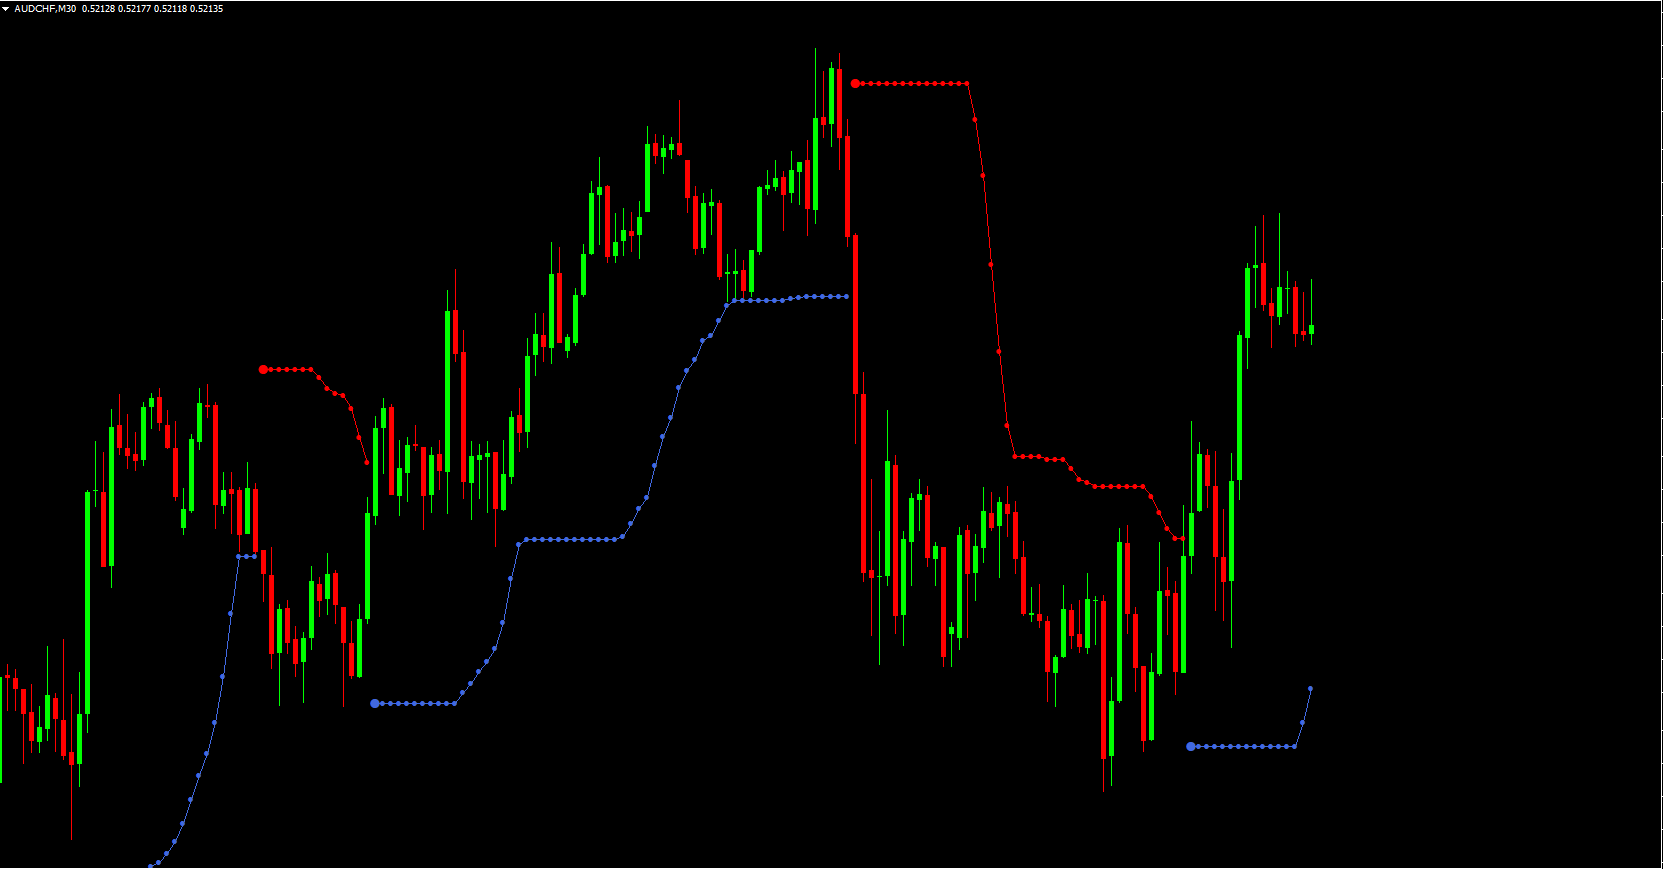
The TopTrend indicator for MT4 is a comprehensive trading tool designed to highlight trend reversal setups and potential price breakout levels on MetaTrader charts. By plotting dynamic Support And Resistance lines, it identifies critical market areas where price is likely to decide its next direction. This makes it an ideal tool for both trend-following and breakout traders.
What is the TopTrend Indicator?
TopTrend combines a 20-period moving average with a 2.0 deviation to plot dynamic support and resistance levels. Its design makes trend visualization intuitive:
Blue Line (Support): Appears below price candles during uptrends, indicating bullish trend support.
Red Line (Resistance): Appears above price candles during downtrends, showing bearish resistance levels.
By monitoring these lines, traders can quickly determine the current market trend and plan upcoming buy or sell orders.
How to Trade Using TopTrend
There are two primary trading approaches with TopTrend:
Pullback Entry Strategy
Wait for a retracement to the dynamic support or resistance line.
Enter in the direction of the trend once the price touches the S/R level.
Hold the position while monitoring Trend Continuation for potential profits.
Breakout Strategy
Observe price behavior at the support/resistance line.
Enter a trade when price breaks through the S/R level, signaling a new trend.
Consider taking profits when price breaks the opposite S/R line or a new trend is confirmed.
Best Timeframes for TopTrend
While effective on shorter timeframes, TopTrend signals are most consistent on longer timeframes like H1, H4, and daily charts. These longer periods reduce market noise and provide more reliable trend and breakout indications.
Advantages of TopTrend
User-Friendly: Easy-to-understand S/R lines and trend signals make it suitable for beginners.
Expert Support: Provides detailed trend and price level insights for advanced traders.
Versatile: Can be applied to forex, stocks, commodities, cryptocurrencies, and more.
Trend & Breakout Guidance: Highlights potential entry and exit points while showing market trend conditions.
Things to Keep in Mind
TopTrend may produce conflicting signals during sideways or low-volatility markets. For best results, use it during highly volatile market conditions or combine it with other indicators such as RSI or MACD to reduce false signals.
Conclusion
The TopTrend indicator for MT4 is an essential tool for traders seeking to identify trend reversals and breakout levels with clarity. Its combination of dynamic support/resistance lines and easy-to-read trend signals makes it effective for both novice and professional traders. Explore IndicatorForest.com to get the TopTrend indicator and enhance your MT4 trading strategy today.
FAQ
1 Download
Published:
Nov 23, 2025 02:25 AM
Category: