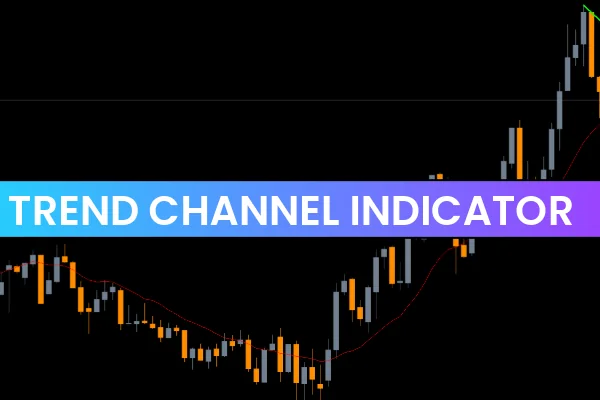
Master Price Geometry: Trend Channel Indicator for MetaTrader 5
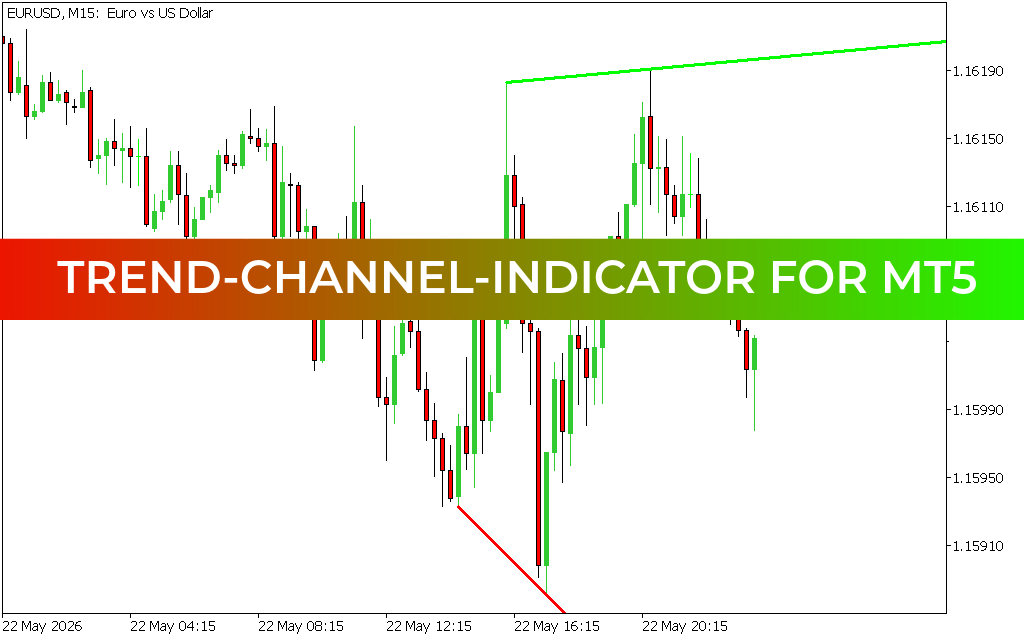
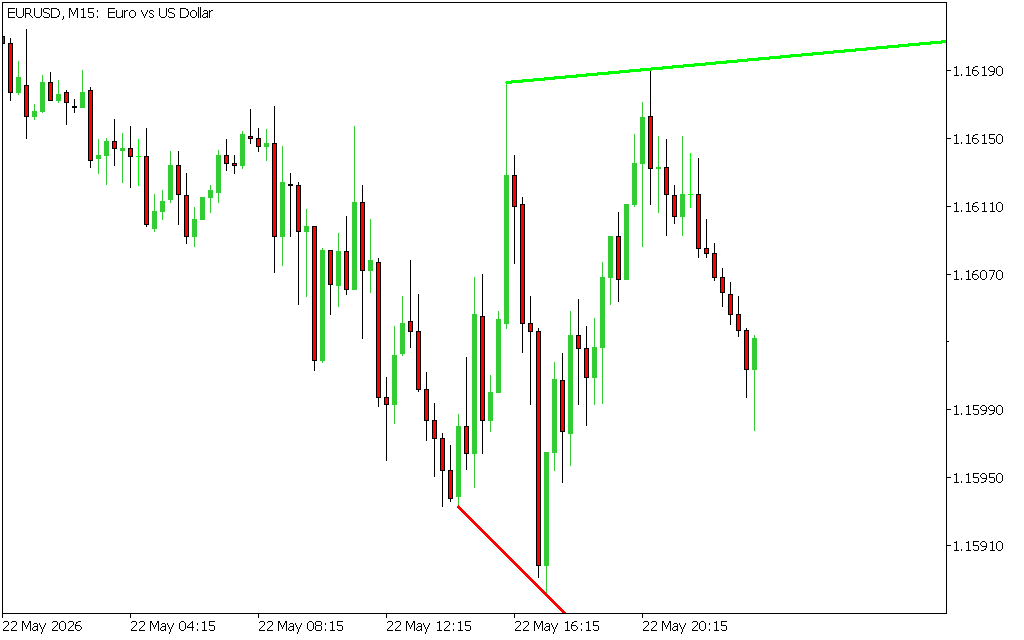
Navigating fast-moving financial markets on intraday timeframes like the 15-minute (M15) chart requires clean structural perspective. For day traders and scalpers, drawing manual trendlines can introduce emotional bias and inconsistency into an execution template. The Trend Channel Indicator for MT5 eliminates this operational friction by mathematically mapping Price Action inside automated, dynamic volatility boundaries directly on your chart workspace.
Understanding the Mechanics of Automated Channel Geometry
The core logic of the Trend Channel Indicator is built around identifying localized structural pivots (swing highs and swing lows) and establishing a clear linear regression path. Instead of forcing price into arbitrary fixed zones, this tool recalculates standard deviation envelopes on every live tick to project real-time institutional boundaries.
When deployed on a liquid asset workspace like the EUR/USD, the indicator organizes price action into three main components:
- The Upper Channel Boundary: Represents local distribution thresholds or overextended premiums. When price rallies into this upper ceiling, buying momentum is statistically exhausted, signaling a high-probability zone for a trend rejection or a mean-reversion short play.
- The Central Median Line: Acts as the market's dynamic equilibrium or fair value anchor. The slope of this line instantly reveals the dominant institutional trend phase—sloping upward for a bullish expansion and downward for a bearish distribution.
- The Lower Channel Boundary: Highlights localized demand pockets or major discount zones. When a high-volume sell-off drives price down into this lower floor, it alerts systematic traders to stop short execution and look for long accumulation patterns.
This real-time envelope framework allows retail traders to quickly distinguish between sustainable trend extensions and deceptive, low-volume breakouts.
Strategic Execution on the EUR/USD M15 Chart
During liquid market hours, major currency pairs cycle continuously through horizontal ranges and violent breakout phases. On an M15 chart workspace, price frequently test the outer limits of a trend channel during key session crosses.
Systematic market participants can utilize this automated geometry to manage two high-probability trading models:
- Trend Continuation Re-Entries: In an established, upward-sloping channel, avoid chasing the price at the upper boundary. Instead, wait for a corrective pullback toward the central median line or the lower channel boundary. When a price action rejection candle (like a pin bar or engulfing pattern) forms at the lower floor, execute a long entry aligned with the master trend.
- Volatility Breakout Filters: If price breaks completely out of the trend channel and holds structural acceptance beyond the outer boundaries, an institutional volatility shift is confirmed. This serves as an objective signal that a new macro trend leg is underway, allowing you to ride the momentum cleanly.
Core Architecture Features for Modern Technical Analysts
- Automated Regression Engine: Completely removes the need to manually draw and adjust channels, updating automatically across changing market cycles to preserve geometric precision.
- Multi-Timeframe Scaling: Seamlessly functions across lower scaling screens like the M1 and M5 for high-velocity Scalping, while providing rock-solid directional mapping on H1, H4, and Daily charts.
- Clutter-Free Chart Blueprint: Plots a highly elegant line matrix directly over your candlesticks, leaving your workspace clean and perfectly compatible with volume profiles, order blocks, or pivot points.
The Trend Channel Indicator for MT5 functions as an indispensable analytical filter, transforming erratic lower-timeframe price action into a highly structured geometric blueprint built for consistent, professional execution.
6 Downloads
Last Update:
May 23, 2026 02:11 AM
Published:
Jan 16, 2026 14:21 PM
Category: