The Trend Intensity Index Indicator oscillates between 0 and 100 to reflect the strength and direction of the current trend. The signal line’s color and level indicate the market state:
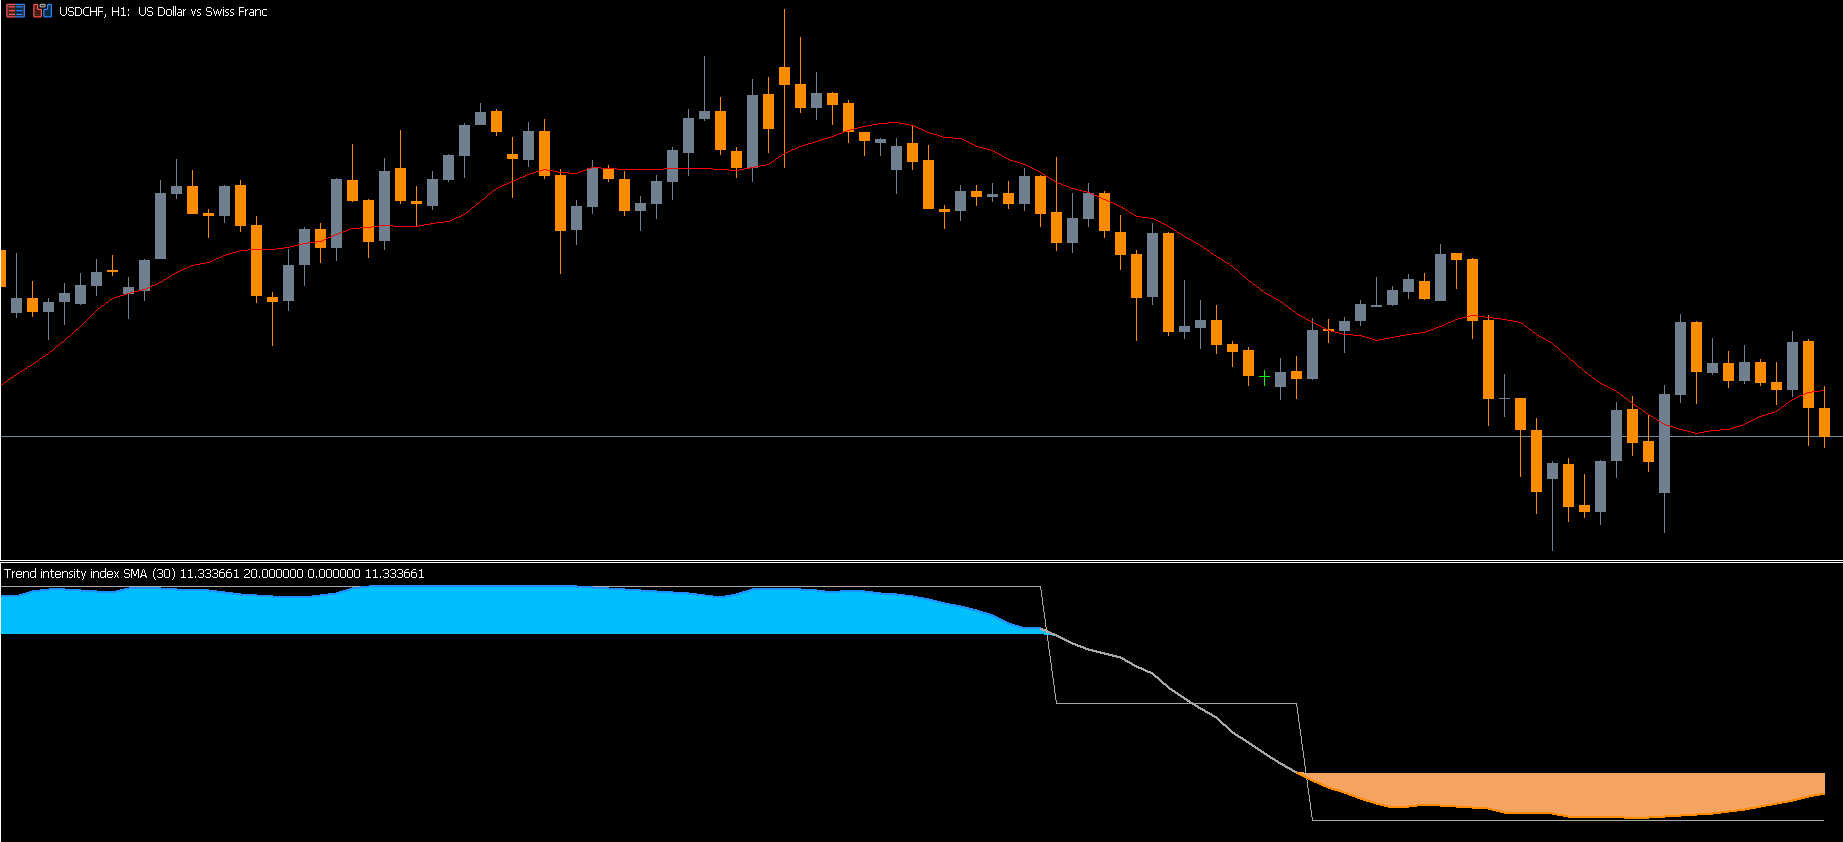
Below 20 (Brown): Market is oversold — potential buy opportunity.
Above 80 (Blue): Market is overbought — possible sell setup.
Between 20–80 (Gray): Indicates active trending conditions; use this range for trade management.
When the signal line rises above 20 and turns gray, the trend is gaining bullish momentum — ideal for long entries. When it drops below 80 from the overbought region, turning gray again, it suggests a weakening uptrend — good for short setups.
How to Trade Using the Trend Intensity Index Indicator for MT5
Buy Signal (Bullish Trend Setup)
Wait for the indicator value to fall below 20 (oversold).
When the line turns gray and crosses back above 20, enter a BUY (LONG) position.
Place your stop loss below the recent swing low.
Exit when the indicator value rises above 80 and turns blue (overbought).
Sell Signal (Bearish Trend Setup)
Wait for the indicator to move above 80, indicating an overbought condition.
When the line drops below 80 and turns gray, enter a SELL (SHORT) position.
Set a stop loss above the recent swing high.
Take profit when the line approaches the 20-level again.
These setups allow traders to follow the trend efficiently while maintaining low risk exposure.
Pro Tips for Using the TII Indicator Effectively
Combine the Trend Intensity Index with Price Action or moving averages for confirmation.
Avoid trading during sideways or choppy markets, as the indicator may give inconsistent signals.
Use multiple timeframes (MTF) to align entries with larger trend directions.
Advantages of the Trend Intensity Index
Clearly shows Trend Strength and market bias.
Generates accurate buy/sell signals in trending markets.
Suitable for all traders — from beginners to professionals.
Works across all timeframes and currency pairs.
Helps optimize entry, holding, and exit decisions.
Conclusion
The Trend Intensity Index Indicator for MT5 is an all-in-one tool for identifying trend direction, strength, and reversals. It combines simplicity with analytical power, helping traders spot opportunities with confidence.
By highlighting overbought and oversold conditions, the indicator ensures that traders enter trades in sync with real market momentum — not against it.
📈 Download the Trend Intensity Index Indicator for free at IndicatorForest.com and start trading smarter with data-driven trend insights today!
FAQ
2 Downloads
Published:
Nov 10, 2025 03:41 AM
Category: