The Trend Lines Day Indicator for MT4 is a powerful forex trading tool that automatically draws two trend lines on your price chart—one acting as resistance and the other as support. These lines help traders identify market direction, breakout points, and potential trade setups. By removing the guesswork from manual chart analysis, this indicator allows traders to focus on executing precise trades rather than struggling to plot trend lines correctly.

Many new forex traders fail to draw trend lines accurately. They often misplace them, resulting in poor trade entries. The Trend Lines Day Indicator for MT4 solves this issue by automatically plotting accurate lines at key highs and lows—ensuring a consistent, objective approach to technical analysis.
Why Use the Trend Lines Day Indicator for MT4
This indicator is valuable for both beginner and advanced forex traders. For new traders, it eliminates the subjectivity of manual line drawing. For experienced traders, it serves as a reliable reference tool to confirm trend-based setups.
Key benefits include:
Automatic plotting of Support And Resistance lines.
Non-repainting signals that remain consistent across all timeframes.
Compatibility with multiple currency pairs and chart types.
Clear trade setups for breakout and rejection strategies.
The indicator’s simplicity makes it suitable for all levels of traders who want to improve the accuracy of their technical analysis.
How the Trend Lines Day Indicator Works
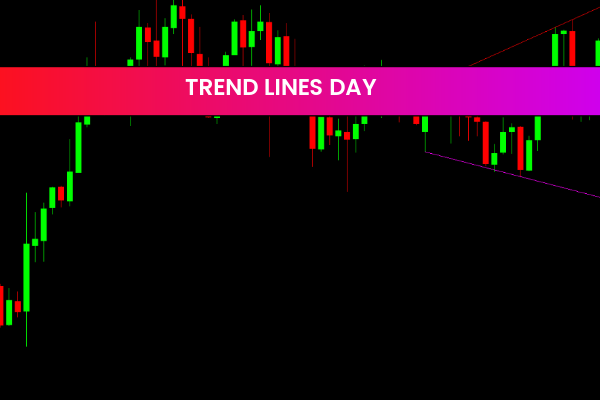
Once installed, the Trend Lines Day Indicator for MT4 displays:
A red upper trend line representing resistance.
A magenta lower trend line representing support.
These lines dynamically adjust based on price movement, giving traders real-time insights into where the market may react next.
Trading Strategies Using the Trend Lines Day Indicator
The indicator works perfectly with Price Action strategies, especially those based on breakout or rejection setups.
Breakout Strategy:
When the price breaks above the red resistance line, it signals potential bullish momentum. Traders may consider entering a buy trade with a stop loss below the previous swing low.
Rejection Strategy:
If the price fails to break the resistance and gets rejected, it often signals a sell opportunity. Conversely, rejection from the magenta support line may suggest a buy setup.
It’s important to confirm these signals using candlestick patterns or momentum indicators for improved accuracy.
Since the indicator does not specify take-profit levels, traders should aim for trades with favorable risk-reward ratios, commonly 1:2 or higher.
Best Practices for Using the Indicator
Combine it with volume or momentum indicators for confirmation.
Apply it on higher timeframes to identify stronger trend structures.
Use proper risk management when entering trades.
Regularly backtest your setups before live trading.
Conclusion
In summary, the Trend Lines Day Indicator for MT4 is an essential tool for traders who rely on support and resistance trading. It saves time, enhances accuracy, and provides objective visual guidance for both novice and professional traders.
If you’re looking to improve your technical analysis and trading performance, download the Trend Lines Day Indicator for MT4 today at IndicatorForest.com and take your forex trading to the next level.
1 Download
Published:
Dec 29, 2025 19:44 PM
Category: