The Trend Manager Indicator is a popular and free Forex Indicator for the MT4 platform. It is designed to help traders analyze market trends and identify profitable trading opportunities quickly. By using color-coded lines and histograms, the indicator provides a clear visual representation of trend strength and direction, making it easier for traders to make informed decisions
.
This indicator is suitable for traders of all experience levels. Its visual approach simplifies market analysis, allowing traders to focus on high-probability trades while reducing the risk of entering during uncertain conditions.
Understanding the Trend Manager Indicator
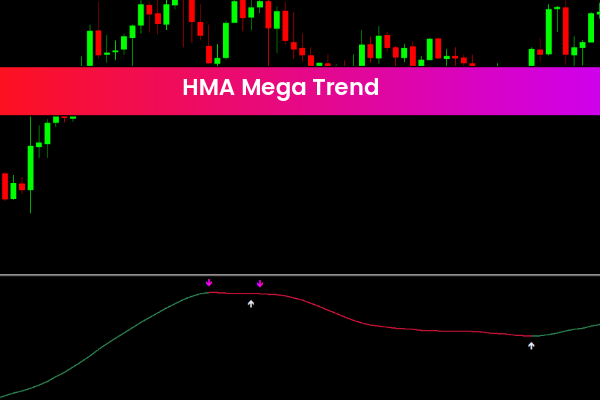
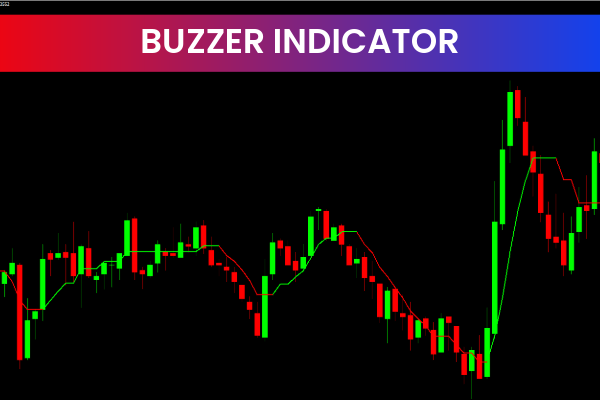
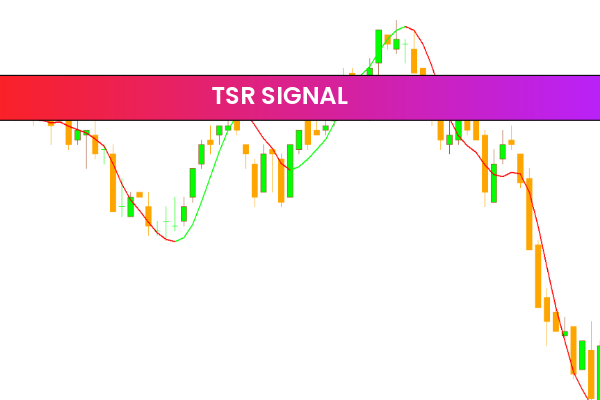
The Trend Manager Indicator works by plotting a series of colored lines on the MT4 chart. Each color corresponds to a different Trend Strength:
Red lines indicate a strong bearish trend
Green lines indicate a strong bullish trend
Intermediate shades represent moderate trends or transitions
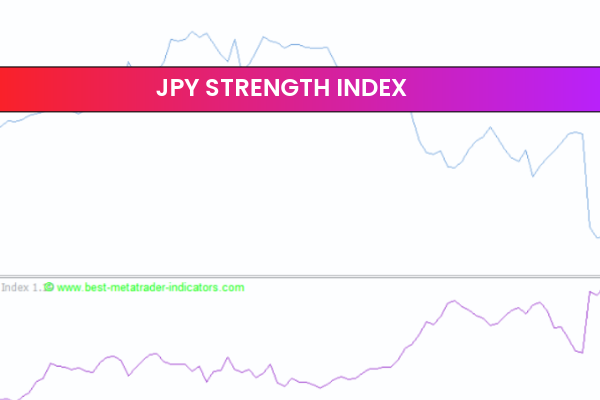
In addition, the indicator displays a histogram that reflects the current trend’s direction and strength. This combination allows traders to quickly assess market conditions without needing to analyze multiple indicators.
How the Indicator Works
The Trend Manager Indicator calculates trend strength based on price movement and momentum. The histogram and colored lines update in real-time, providing instant insight into changing market conditions.
Histogram and Color Signals
A rising green histogram confirms an upward trend
A falling red histogram confirms a downward trend
Changes in color and histogram patterns signal trend reversals or weakening trends
Customizable Settings
Traders can adjust the indicator’s colors, sensitivity, and display settings to match their trading style. This flexibility allows it to be used effectively across multiple timeframes and trading strategies.
Identifying Entry and Exit Points
The Trend Manager Indicator is ideal for determining when to enter or exit trades:
Enter long trades when the histogram rises and the lines turn green
Enter short trades when the histogram falls and the lines turn red
Consider exiting trades when the trend weakens or lines change color
By following these visual signals, traders can align their trades with the dominant market trend.
Key Benefits of Using the Trend Manager Indicator
Clear Trend Analysis
The indicator removes confusion by providing an easy-to-read visual representation of trend strength and direction.
Quick Decision-Making
Color-coded lines and histograms allow traders to quickly identify potential trading opportunities.
Customizable and Flexible
The indicator can be adjusted to suit different trading styles, timeframes, and currency pairs.
Suitable for All Traders
Its simplicity makes it accessible for beginners, while its accuracy and flexibility appeal to experienced traders.
Combining the Indicator with Other Tools
For enhanced trading performance, the Trend Manager Indicator can be used alongside:
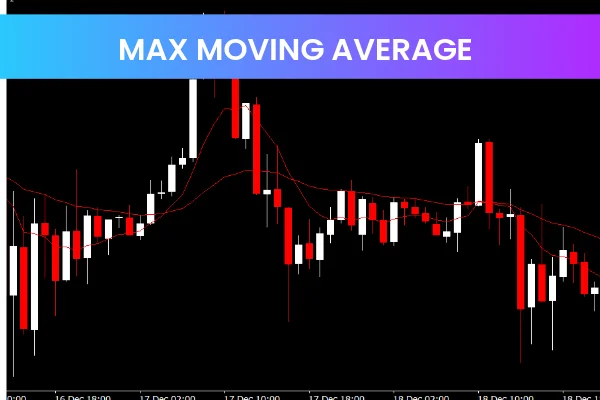
Moving averages
Trendlines and Price Action signals
Risk management strategies
This combination improves trade accuracy and reduces the risk of false signals.
Why the Trend Manager Indicator Is Popular
The Trend Manager Indicator is widely used because it provides clear, actionable trend information at a glance. Its combination of colored lines and histogram signals makes it one of the most reliable and beginner-friendly MT4 indicators available.
For more free and professional MT4 Forex indicators, visit IndicatorForest.com and access a wide range of tools designed to help traders improve their market analysis and trading performance.
FAQ
Published:
Dec 19, 2025 01:07 AM
Category: