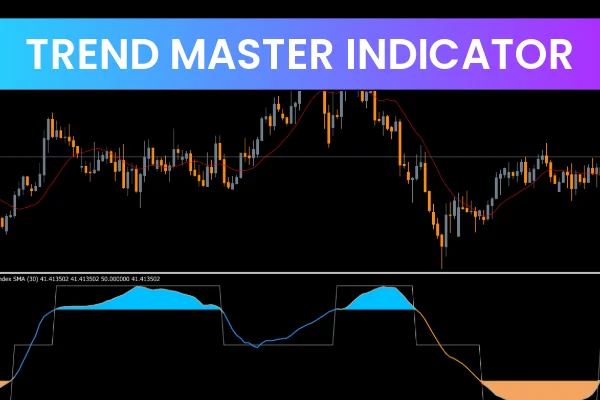
The Trend Master Indicator for MT5 is one of the simplest and most user-friendly tools designed to identify the current trend direction of any financial instrument. By plotting colored arrows directly on the chart, the indicator visually represents whether the market is moving upward or downward.
This simplicity makes it perfect for beginner traders who want to avoid confusing technical setups while still benefiting from accurate trend detection. The indicator eliminates market noise and helps traders make confident trading decisions based purely on trend direction.
With blue and red arrows signaling bullish and bearish movements, the Trend Master MT5 Indicator provides a clean and efficient way to follow the market without cluttered charts.
How the Trend Master Indicator Works
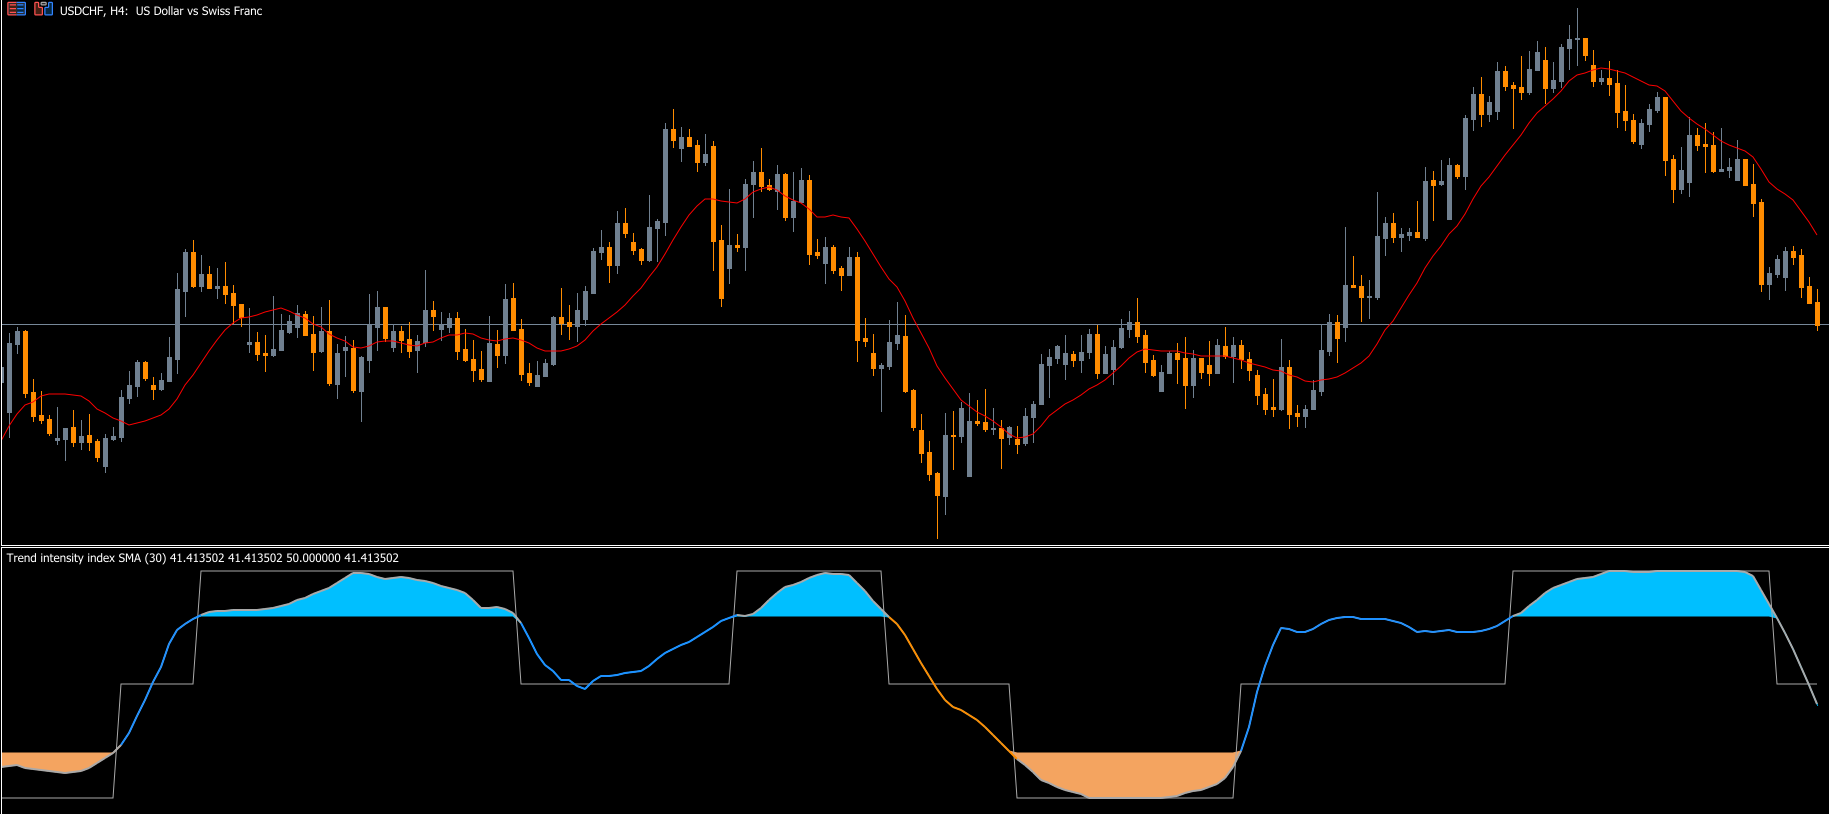
The Trend Master Indicator identifies the overall market bias by analyzing price momentum and trend direction.
A Blue Arrow indicates a bullish trend, meaning the price is expected to rise.
A Red Arrow signals a bearish trend, suggesting the price may move downward.
Each time the market changes direction, the indicator immediately displays a new arrow, alerting the trader to potential trading opportunities.
This makes it ideal for trend-following strategies, allowing you to enter trades in the direction of the trend and avoid counter-trend setups that can lead to unnecessary losses.
Advantages of Using the Trend Master Indicator MT5
Simple and Visual: No need for complex technical analysis—just follow the arrows.
Versatile: Works on all timeframes and currency pairs.
Reduces Market Noise: Focus only on the dominant market direction.
Beginner-Friendly: Easy setup and interpretation for traders of all levels.
Customizable Alerts: Get notified instantly when the trend changes direction.
By combining simplicity with effectiveness, the Trend Master Indicator for MT5 serves as an essential tool for traders seeking clarity and confidence in their trading decisions.
How to Trade Using the Trend Master Indicator
Trend Master Buy Strategy
Keep the RISK parameter at default.
Wait for a Blue Arrow to appear on the chart.
Confirm that the trend is continuing upward.
Enter a Buy Trade on the candle where the blue arrow appears, or wait for the next candle for a conservative entry.
Place your Stop Loss below the most recent swing low.
Set your Take Profit near the next resistance level.
💡 Tip: For added confirmation, combine this with the Moving Average or RSI indicator to filter out false signals.
Trend Master Sell Strategy
Keep the RISK parameter at default.
Wait for a Red Arrow to appear on the chart.
Confirm that the price is continuing downward.
Enter a Sell Trade on the candle where the red arrow appears, or wait for the next candle for safety.
Place your Stop Loss above the most recent swing high.
Set your Take Profit near the next support level.
💡 Pro Tip: Avoid trading against strong higher-timeframe trends. For best results, align the Trend Master signals with higher timeframe confirmation.
Best Timeframes and Assets
The Trend Master Indicator can be applied to all major currency pairs, indices, commodities, and even cryptocurrencies. It performs well on:
M15 to H4 charts for intraday and swing trading.
H1 and H4 for more reliable medium-term setups.
Scalpers can use it on lower timeframes, while long-term traders can apply it to daily or weekly charts.
Combining the Trend Master Indicator with Other Tools
Although the indicator works well on its own, pairing it with other tools enhances accuracy:
Moving Average (MA): Confirms overall trend direction.
RSI (Relative Strength Index): Detects overbought or oversold conditions.
MACD: Helps identify momentum and possible divergences.
By using such confirmations, traders can increase the probability of entering trades that align with both short-term and long-term trends.
Conclusion
The Trend Master Indicator for MT5 is a simple yet highly effective trend-following tool. It removes confusion by presenting clear buy (blue arrow) and sell (red arrow) signals, helping traders make quick and confident decisions.
Whether you are new to forex trading or an experienced trader seeking a clean and reliable visual system, this indicator will help you stay aligned with the trend and avoid unnecessary market noise.
Combine it with Price Action or confirmation indicators for best results and improved trade accuracy.
Download the Trend Master Indicator for MT5 today from IndicatorForest.com and start trading with clarity and confidence.
FAQ
7 Downloads
Published:
Nov 12, 2025 10:45 AM
Category: