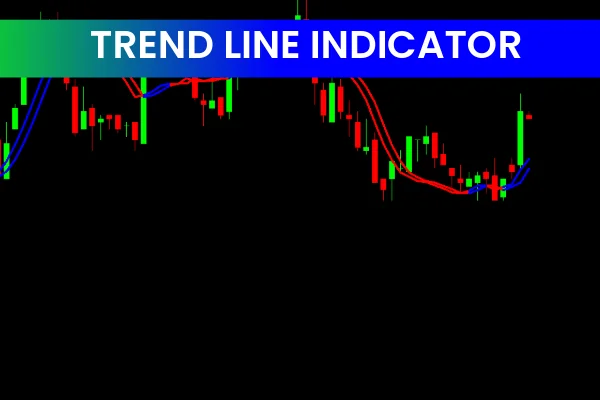
The Trendline Indicator is a useful, popular, and free Forex Indicator designed for the MetaTrader 4 (MT4) platform. It helps traders automatically identify and draw trendlines on price charts, making trend analysis faster, clearer, and more objective. Since trading in the direction of the trend is a core principle of technical analysis, this indicator is an essential tool for traders at all experience levels.
By automatically detecting swing points and connecting them to form trendlines, the Trendline Indicator removes subjectivity and allows traders to focus on high-probability trading opportunities.
What Is the Trendline Indicator
The Trendline Indicator is a technical analysis tool that automatically draws trendlines based on price movements. When two or more significant price points are detected, the indicator connects them to form valid trendlines on the chart.
These trendlines help traders visually identify whether the market is in an uptrend, downtrend, or consolidation phase. This allows traders to align their trades with the dominant market direction and avoid trading against momentum.
Key Features of the Trendline Indicator
The Trendline Indicator offers several practical features that make it highly effective for Forex trading.
Automatically draws trendlines on the chart
Identifies both bullish and bearish trends
Works on all currency pairs and timeframes
Eliminates manual trendline drawing
Helps locate potential entry and exit zones
Fully compatible with the MT4 platform
These features make the indicator suitable for Scalping, intraday trading, and swing trading strategies.
How the Trendline Indicator Works
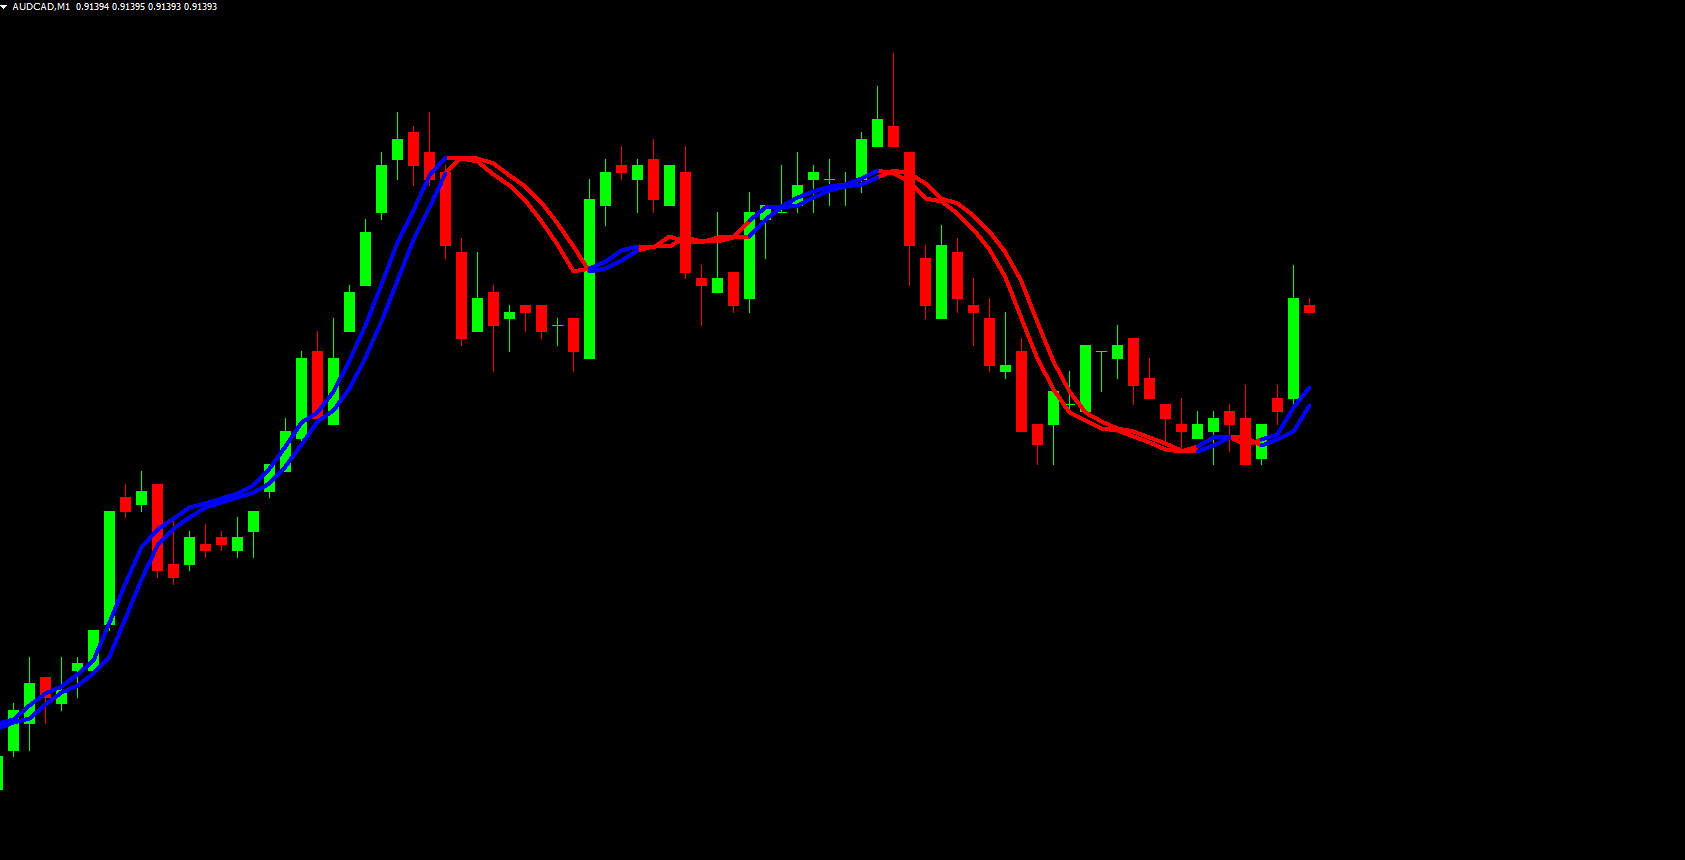
The indicator scans Price Action to identify swing highs and swing lows. When two or more relevant points align, the indicator automatically draws a trendline connecting them. This process ensures that trendlines are drawn consistently and objectively.
In an uptrend, the Trendline Indicator connects higher lows to form a rising trendline. In a downtrend, it connects lower highs to form a descending trendline. These trendlines act as dynamic Support And Resistance levels, helping traders anticipate price reactions.
Benefits of Using the Trendline Indicator
Clear Trend Identification
The indicator visually displays the current market trend, making it easier to determine whether to look for buy or sell opportunities.
Objective Analysis
By automating trendline drawing, the indicator removes emotional bias and subjective interpretation from technical analysis.
Improved Trade Timing
Traders can use trendlines to enter trades on pullbacks and exit near potential breakout or reversal zones.
Beginner-Friendly Tool
The Trendline Indicator is easy to use and requires no advanced technical knowledge, making it ideal for beginners.
Trading Strategies Using the Trendline Indicator
One effective strategy is Trend Continuation trading. Traders can wait for price to pull back toward the trendline and enter trades in the direction of the trend. Another approach is breakout trading, where traders look for price to break and close beyond the trendline, signaling a possible trend reversal.
For higher accuracy, the Trendline Indicator can be combined with indicators such as RSI, MACD, or moving averages to confirm trend strength and momentum.
Who Should Use the Trendline Indicator
This indicator is ideal for:
Beginner Forex traders
Trend-following traders
Price action traders
Scalpers, day traders, and swing traders
If you want to improve your trend analysis and trade with greater confidence, visit IndicatorForest.com and explore the Trendline Indicator along with other professional MT4 Forex tools.
FAQ
The Trendline indicator helps traders identify trend direction and potential support and resistance levels by automatically drawing trend lines on the chart. It analyzes price action to detect significant trend lines that can guide entry and exit decisions and help traders understand market structure.
By automatically identifying and drawing trend lines, the indicator saves time and reduces subjective analysis. It helps traders quickly see important trend lines that might be difficult to spot manually, providing clear visual guidance for trend-following strategies.
Yes, trend lines often act as dynamic support or resistance. Traders can look for buy opportunities when price bounces off an upward trend line (support) or sell opportunities when price rejects a downward trend line (resistance), using these levels for entry timing.
When a trend line is broken, it may signal a potential trend reversal or acceleration. A break of an upward trend line could indicate weakening bullish momentum, while a break of a downward trend line might suggest weakening bearish pressure, helping traders adjust their positions.
Yes, combine trend line analysis with other tools like volume indicators, momentum oscillators, or candlestick patterns for confirmation. Using multiple confirmations helps validate trend line breaks and bounces, reducing false signals and improving trade quality.
1 Download
Published:
Dec 16, 2025 03:04 AM
Category: