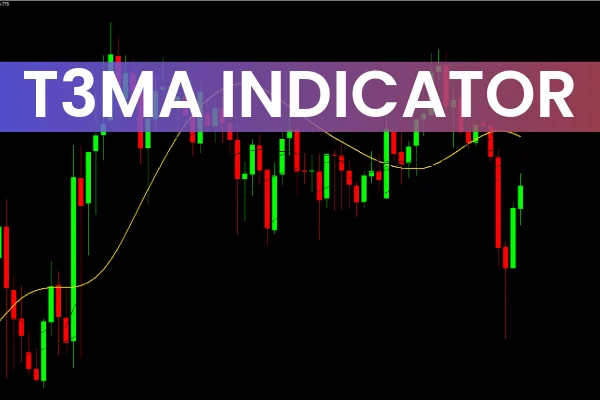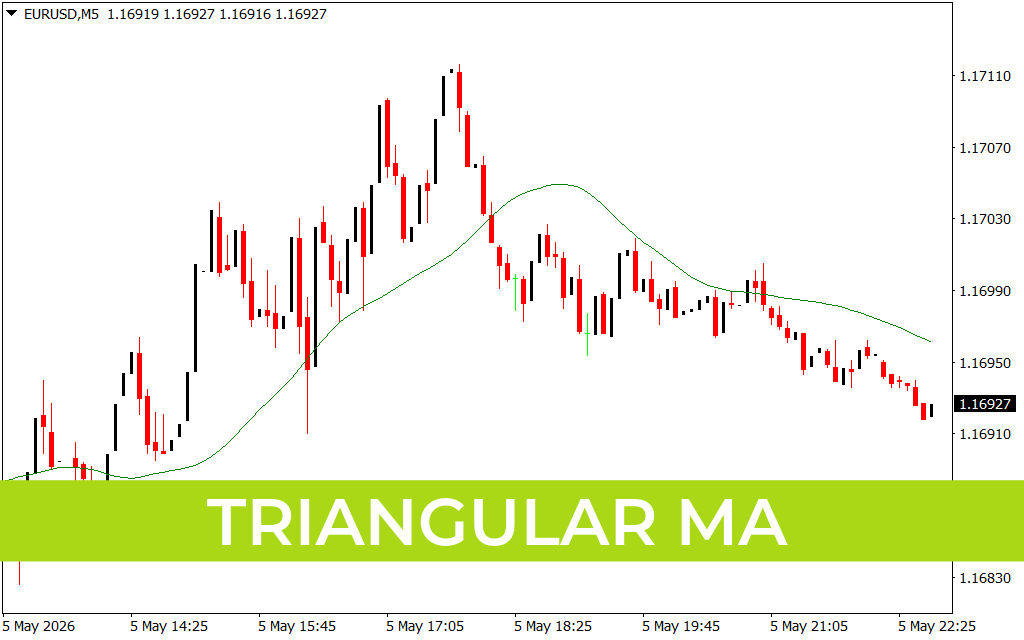
Achieve Superior Smoothness with the Triangular MA Indicator
In the world of technical analysis, moving averages are the bedrock of trend identification. However, standard moving averages can often be "choppy" or overly reactive to minor price spikes. The Triangular MA (TMA) indicator is a sophisticated alternative designed specifically for traders who prioritize extreme smoothness and clear trend visualization. By applying a double-averaging process, the TMA filters out market noise more effectively than almost any other moving average variant.
Download Triangular MA for free. Achieve superior chart smoothness and filter market noise with this professional double-smoothed moving average indicator.
What Makes the Triangular MA Unique?
The Triangular Moving Average is essentially an average of an average. While a Simple Moving Average (SMA) gives equal weight to all prices in its period, and an Exponential Moving Average (EMA) focuses on recent data, the TMA weights the middle of the time series most heavily. This results in a distinctive, wave-like line that is less susceptible to temporary market "hiccups" and false breakouts.
The mathematical beauty of the TMA lies in its triangular weight distribution. This ensures that the most significant Price Action—the core movement of the trend—is what drives the indicator, providing a stable reference point for traders even during volatile market sessions.
Key Benefits for Traders
- Ultimate Noise Reduction: The double-smoothing process creates a much steadier line, making it easier to identify the true underlying trend without being distracted by insignificant price wicks.
- Visual Trend Clarity: Because the TMA is so smooth, it clearly defines market "cycles." When the slope is positive, the trend is undeniably bullish; when it turns negative, bearish momentum is taking over.
- Dynamic Support And Resistance: Much like other moving averages, the TMA acts as a dynamic floor or ceiling. During strong trends, price often pulls back to the TMA before resuming its primary direction.
- Versatile Timeframe Application: The TMA is highly effective on intraday charts for Scalping, as well as on daily or weekly charts for long-term trend following.
Trading Strategy: Riding the TMA Wave
The most common way to utilize the Triangular MA is for trend confirmation. A simple yet effective strategy involves looking for price crosses. A Buy Signal occurs when the price closes above a rising TMA line. A Sell Signal is generated when the price breaks below a falling TMA line.
Because the TMA is exceptionally smooth, it is also an excellent tool for setting trailing stop-losses. By trailing your stop just behind the TMA line, you allow your winning trades enough "room to breathe" while ensuring you exit as soon as the core market momentum shifts against you.
Conclusion
The Triangular MA indicator is an indispensable tool for traders who seek a cleaner, more stable view of the markets. By smoothing out the chaos of raw price action, it allows you to trade with greater composure and precision. Whether you are a beginner looking for a simple trend filter or a professional building a complex trading system, the Triangular MA provides the structural stability needed for consistent success.
2 Downloads
Last Update:
May 06, 2026 01:49 AM
Published:
Jan 27, 2026 02:48 AM
Category: