Simplify Trend Trading with the Trix Arrows Indicator
In the pursuit of market profitability, most traders face the same primary obstacle: market noise. Traditional oscillators often generate erratic signals during volatile sessions, leading to costly "whipsaws." The Trix Arrows Indicator is a sophisticated technical tool designed to solve this by providing triple-smoothed momentum signals. By filtering out minor price fluctuations, it allows you to focus on the significant trend shifts that drive consistent returns.
What is the Trix Arrows Indicator?
The Trix (Triple Exponential Average) is a powerful oscillator used to identify overbought and oversold conditions while acting as a trend-following Momentum Indicator. The "Arrows" version of this tool simplifies the technical output by placing clear visual cues directly on your indicator sub-window.
Unlike a standard moving average that may lag significantly, the Trix uses a triple-smoothing process to calculate the 1-period percentage rate of change of a triple exponentially smoothed moving average. This unique calculation provides a rare balance: it is smooth enough to ignore noise but responsive enough to catch major reversals early.
Key Features of the Trix Arrows System
- Zero-Lag Momentum Tracking: The triple-smoothing algorithm helps eliminate the "lag" associated with many trend-following indicators, providing more timely entries.
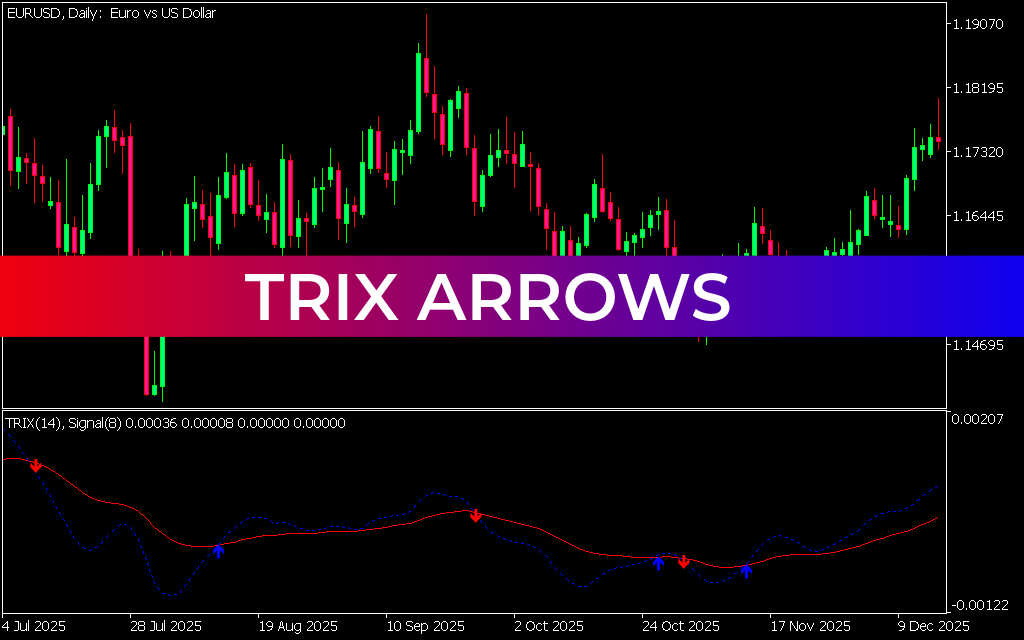
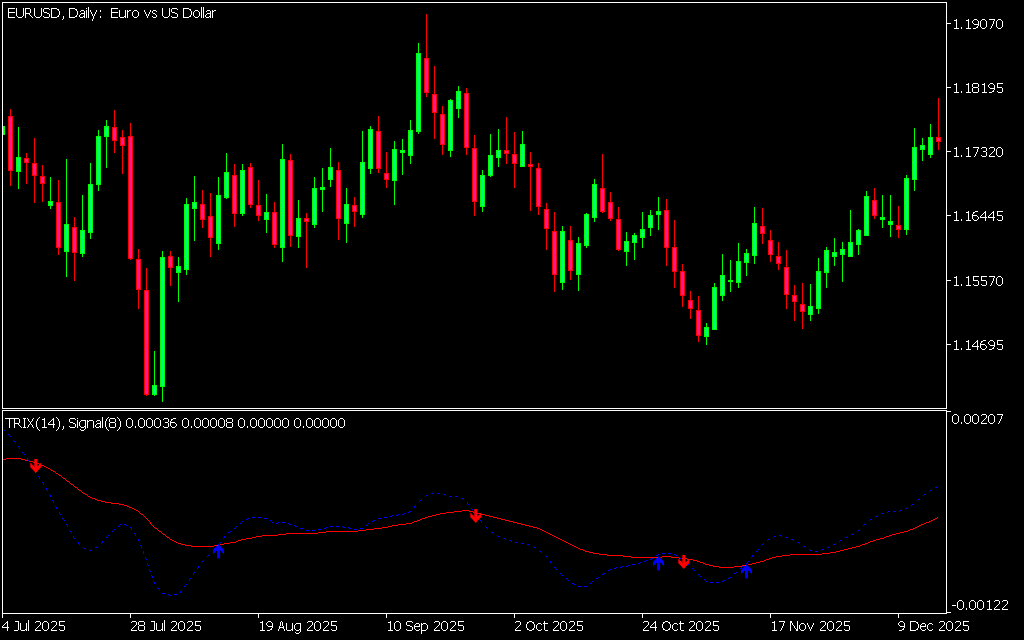
- Clear Visual Signals: As seen in the technical display of the provided chart, the indicator uses blue arrows for bullish momentum and red arrows for bearish momentum.
- Divergence Spotting: The Trix is exceptionally gifted at identifying price-momentum divergence, which often precedes massive market reversals.
- Versatility: This indicator is suitable for all asset classes, including Forex, Stocks, and Commodities, and performs reliably on timeframes ranging from M15 to Daily.
Strategic Implementation
The Trix Arrows Indicator is most effective when used to identify "cross-over" momentum. In the chart example, notice how the dashed blue signal line interacts with the solid red Trix line.
- Bullish Confirmation: A blue arrow appears when the faster Trix line crosses above the signal line. This indicates that buying pressure is accelerating and a new uptrend may be forming.
- Bearish Confirmation: A red arrow appears when the Trix line crosses below the signal line. This serves as an objective signal that momentum has shifted to the downside.
- Trend Filtering: In a strong trending market, traders can use the Trix Arrows to "buy the dip." By only taking signals that align with a higher-timeframe trend, you significantly increase your win rate.
Conclusion
The Trix Arrows Indicator is a must-have for traders who value mathematical precision and visual clarity. By stripping away the chaos of raw Price Action and delivering triple-smoothed signals, it empowers you to trade with the prevailing market wind at your back. Stop guessing the trend and start using the Trix Arrows to identify high-probability entries with institutional-grade accuracy.
4 Downloads
Last Update:
May 05, 2026 20:15 PM
Published:
Jan 27, 2026 14:22 PM
Category: