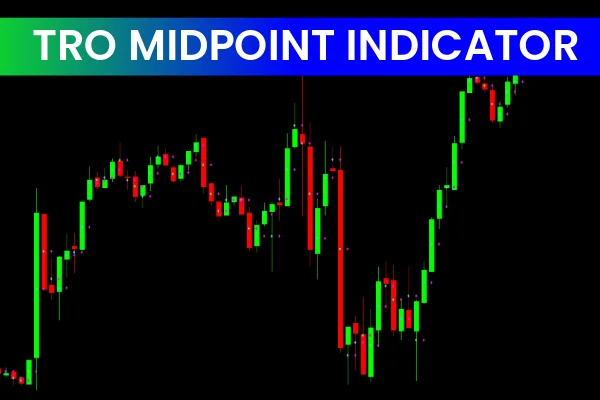
The TRO Midpoint Indicator for MT4 is a price-based tool that plots the current candle midpoint and the previous midpoint of the selected timeframe. Unlike many complex indicators, the TRO Midpoint Indicator does not use any mathematical formula or smoothing calculation—it relies solely on raw price data. This makes it highly valuable for traders who prefer clean, direct, and unfiltered technical analysis.
Because it is simple to read and easy to apply, new forex traders can use it effectively. At the same time, advanced traders can build more complex strategies by combining midpoint data with other indicators and price-action tools. It works across all chart timeframes, but it is especially popular among scalpers and short-term forex traders due to its responsiveness and accuracy.
How the TRO Midpoint Indicator Works
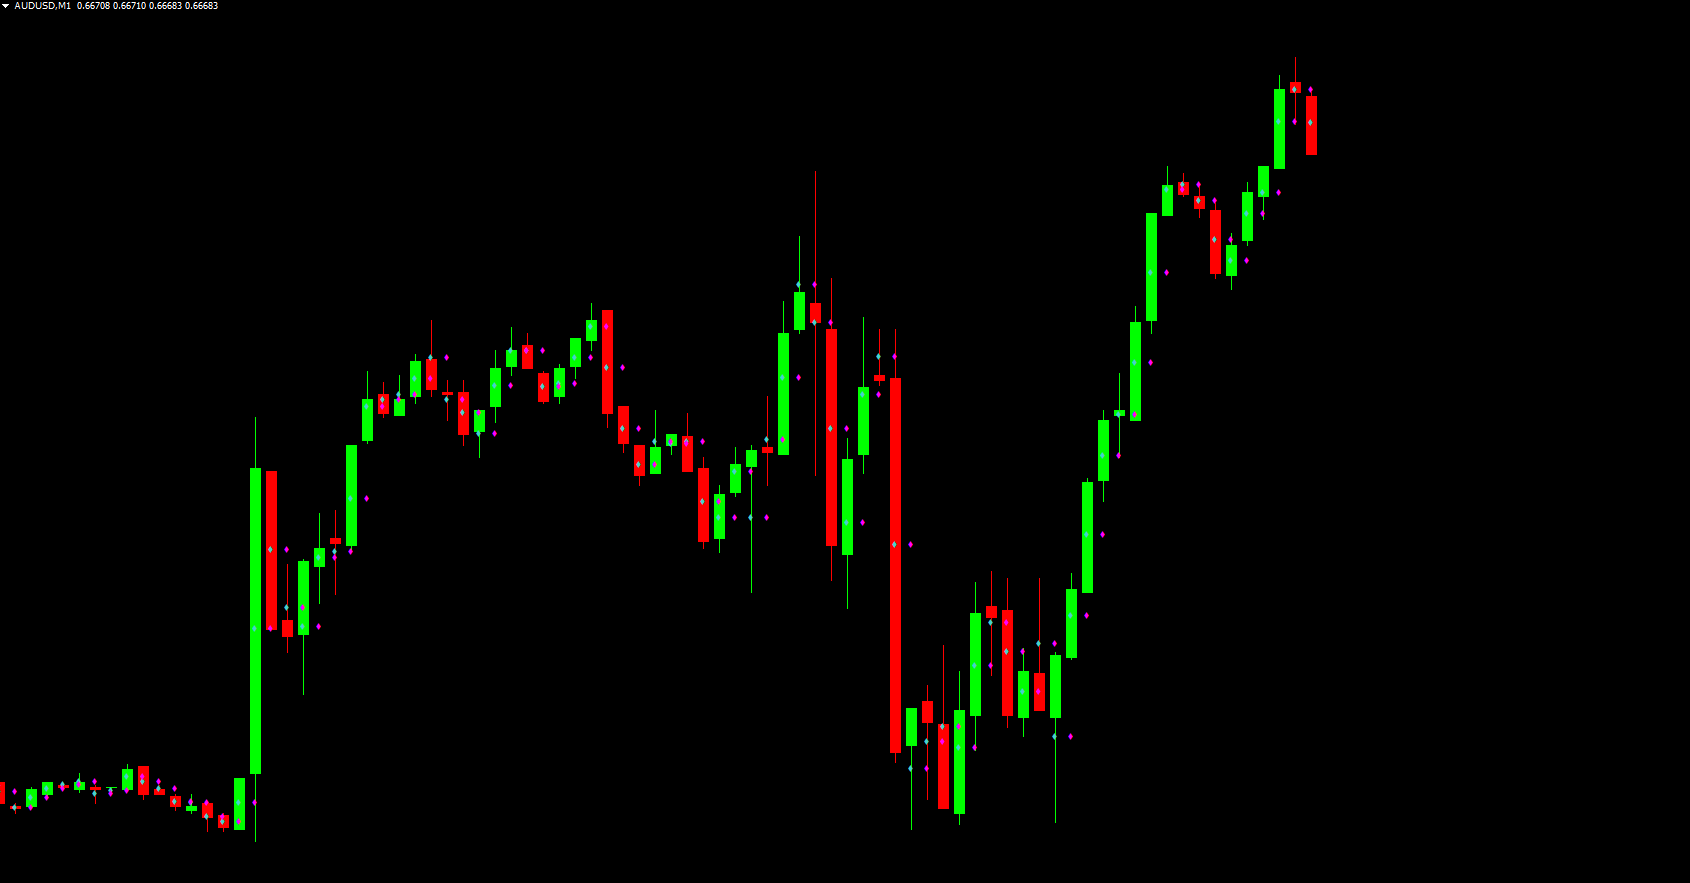
The indicator plots two types of signals directly on the price chart:
Magenta dots – midpoint of the previous candle or selected input timeframe
Medium turquoise dots – midpoint of the current candle
Additionally, traders can enable display boxes on the chart corner to show the exact midpoint values. Because these midpoints react instantly to price changes, they provide a real-time reference for trend direction and momentum.
Understanding Midpoint Signals
The core idea is straightforward:
If the magenta dot is below the candlestick, the trend is bullish.
If the magenta dot is above the candlestick, the trend is bearish.
This simple rule allows traders to quickly identify market direction without relying on lagging indicators.
Trading Signals with the TRO Midpoint Indicator
Buy Signal
A buy setup occurs when the midpoint dot forms below the candlestick. This indicates buying pressure and a potential upward continuation.
Recommended trade plan:
Entry: When the magenta dot appears below the candle
Stop loss: Below the previous swing low
Take profit: When a new magenta dot forms inside the candle body or above the candle, signaling weakening bullish momentum
Sell Signal
A sell setup appears when the midpoint dot forms above the candlestick, signaling bearish strength.
Trade plan:
Entry: When the magenta dot is above the candle
Stop loss: Above the previous swing high
Take profit: When the dot shifts into the body or below the candle, showing loss of bearish momentum
This simple logic makes the TRO Midpoint Indicator effective for:
Intraday trading
Trend Continuation setups
Momentum confirmation
Algorithmic trading systems
Why the TRO Midpoint Indicator Is Popular
Because the indicator uses only price data (no additional formulas), its signals are immediate and reliable. This offers several advantages:
Key Benefits
Zero-lag trend detection
Works on all MT4 timeframes
Easy for beginners to understand
Effective for advanced trading systems
Helps filter false breakouts
Supports scalping, day trading, and short-term swing trading
Combining TRO Midpoint with Other Tools
Although the TRO Midpoint Indicator is powerful alone, traders often combine it with:
Moving averages for trend filtering
Support And Resistance zones
Session indicators (London, NY)
Economic calendar awareness
Volume or volatility indicators
These combinations help confirm midpoint signals and improve overall accuracy.
Final Thoughts
In summary, the TRO Midpoint Indicator for MT4 is a clean, price-based tool ideal for traders who want fast, reliable signals without complex calculations. It is especially useful for scalpers and short-term traders who depend on rapid trend detection.
For more MT4 indicators, strategies, and trading resources, visit IndicatorForest.com
FAQ
Published:
Dec 10, 2025 15:10 PM
Category: