Lock in High-Probability Volatility Corridors with True Fractals Bands Mtf
One of the biggest hurdles retail day traders face is structural blindness. It is easy to spot a localized price breakout on a lower timeframe, only to find yourself trading straight into a massive, unmapped daily or weekly resistance block. Staring exclusively at a single chart timeframe causes traders to completely miss the broader macroeconomic trend channels, leading to preventable losses and broken strategies.
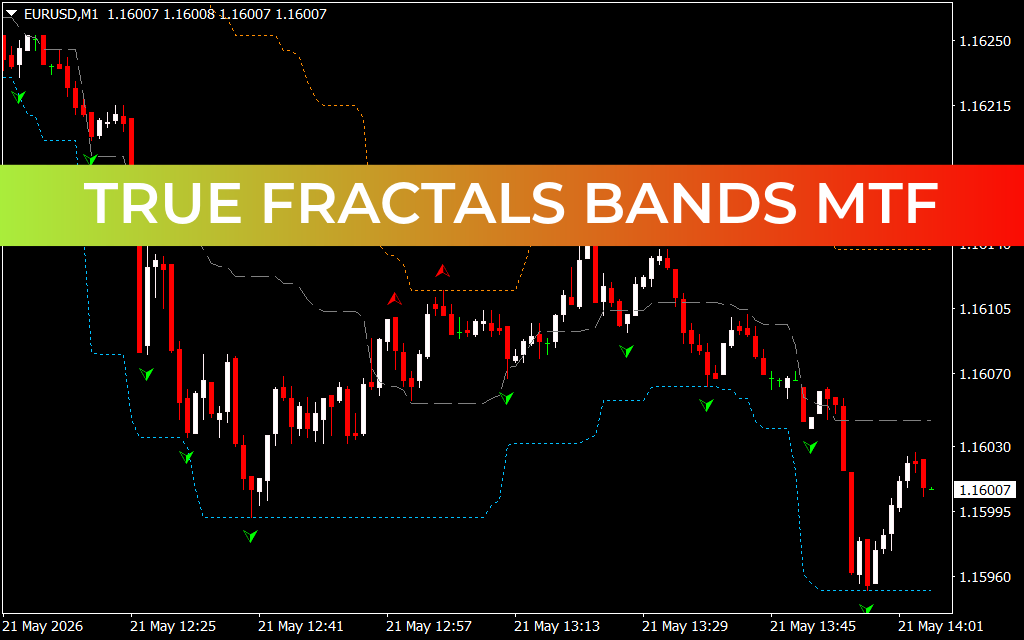
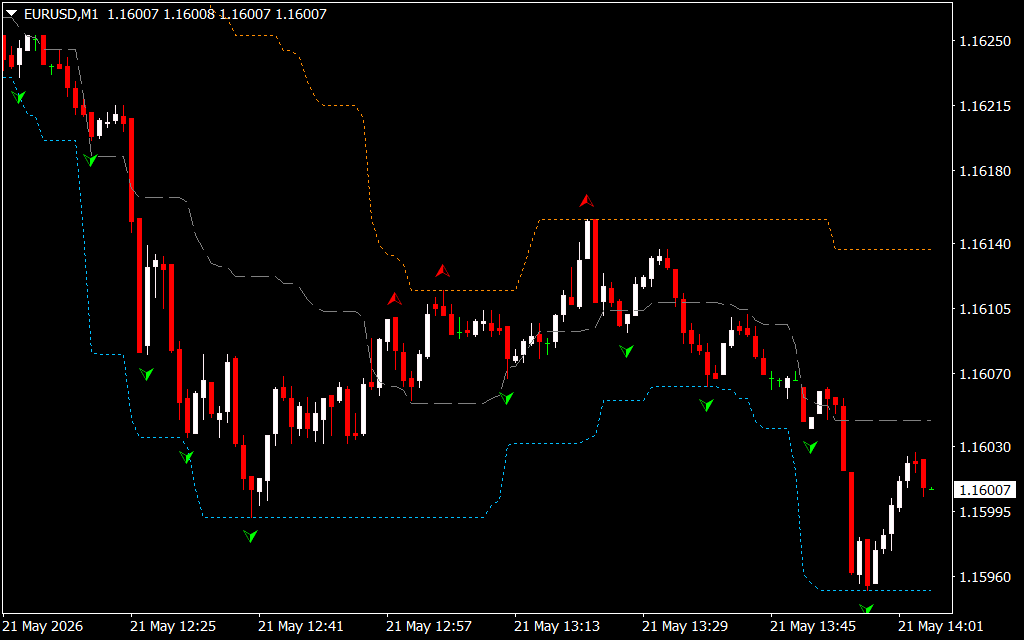
The True Fractals Bands Mtf indicator provides the ultimate technical solution to this challenge. By combining the geometric perfection of fractal turning points with multi-timeframe (MTF) infrastructure, this premium indicator projects macro support floors and resistance ceilings directly onto your active short-term workspace.
What is the True Fractals Bands Mtf Indicator?
The True Fractals Bands Mtf indicator is an advanced volatility channel engine engineered for modern MetaTrader platforms. It expands on Bill Williams' classic fractal theory—which uses specific candlestick sequences to locate structural peaks and troughs—and links those key coordinates into dynamic horizontal or sloped band envelopes.
Unlike standard channel overlays that lock your data to your current chart setting, the multi-timeframe integration allows the software to pull trend geometry from higher timeframes. While you scale or scalp immediate price movements on an M1 or M5 chart, the indicator automatically calculates and projects the structural volatility bands of the M15, H1, or daily frames. This ensures you always view localized Price Action through a macro lens.
Key Features and Strategic Advantages
- Multi-Timeframe Structural Mapping: Overlays major higher-timeframe Support And Resistance boundaries onto your active execution screen.
- Dynamic Volatility Channels: The upper and lower bands expand and contract automatically to mirror genuine, institutional volume distribution.
- Clutter-Free Workspace Geometry: Replaces chaotic hand-drawn trend lines with crisp, clean mathematical bounds that do not repaint behind historical bars.
- Universal Application: Performs with elite accuracy across diverse asset classes, whether you trade liquid Forex pairs, index futures, or spot commodities.
How to Trade with True Fractals Bands Mtf
Integrating these advanced mathematical boundaries into your rule-based strategy significantly improves your execution consistency:
1. Volatility Band Reversals
The extreme upper and lower lines generated by the indicator function as major structural walls. When price action stretches to touch the outer band of a higher timeframe, it marks a zone of severe statistical exhaustion. Look for counter-trend candlestick confirmations to catch highly profitable mean-reversion bounces back toward the median baseline.
2. Advanced Multi-Timeframe Breakouts
When a compressed market builds enough institutional momentum to close a candlestick completely outside a macro fractal band boundary, a major structural breakout is confirmed. Traders can confidently enter long or short positions in the direction of the breakout, riding the new macro expansion wave early.
3. Framing Protective Stops
The dynamic bands offer highly objective visual baselines for framing your risk management parameters. When entering a long position off an indicator bounce, place your defensive stop-loss safely below the lower fractal band line to keep your position completely insulated from retail market noise.
Conclusion
Relying on a single chart timeframe leaves you vulnerable to institutional liquidity traps. The True Fractals Bands Mtf indicator converts multi-timeframe structural data into a clean, actionable road map of the market's true boundaries. Download this essential technical software today to upgrade your charting layout and execute trades with absolute multi-timeframe clarity.
9 Downloads
Last Update:
May 21, 2026 17:06 PM
Published:
Jan 17, 2026 19:19 PM
Category: