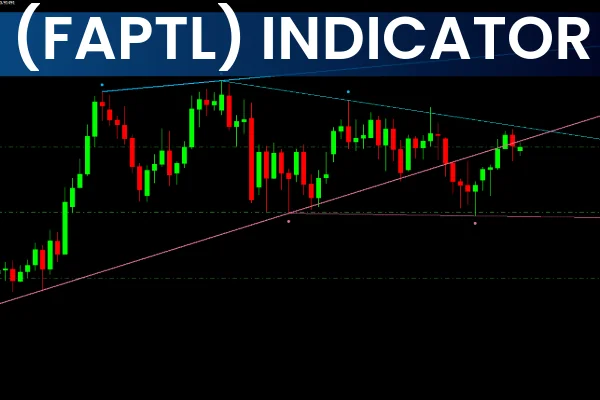
Master Market Geometry with the True Fractals Bands MTF Indicator
In technical analysis, relying solely on lagging indicators frequently exposes day traders and swing traders to late entries and false breakouts. Financial markets move in repetitive, cyclical structures governed by localized swing points. To track these shifting boundaries accurately, professional traders use price geometry to map clear Supply And Demand zones. The True Fractals Bands MTF (Multi-Timeframe) indicator is an advanced charting utility designed to automate this process. It combines Bill Williams' fractal math with dynamic, step-like envelope channels.
By mapping key price extensions directly onto your primary terminal canvas, this powerful tool establishes a highly structured visual blueprint for tracking trends and spotting reversals.
Understanding the Mechanics of Multi-Timeframe Fractal Bands
Standard volatility bands often provide a smoothed curve that masks exact structural price pivots. The True Fractals Bands MTF indicator removes this limitation by replacing traditional curves with precise, step-like geometric channels calculated from historical fractal highs and lows.
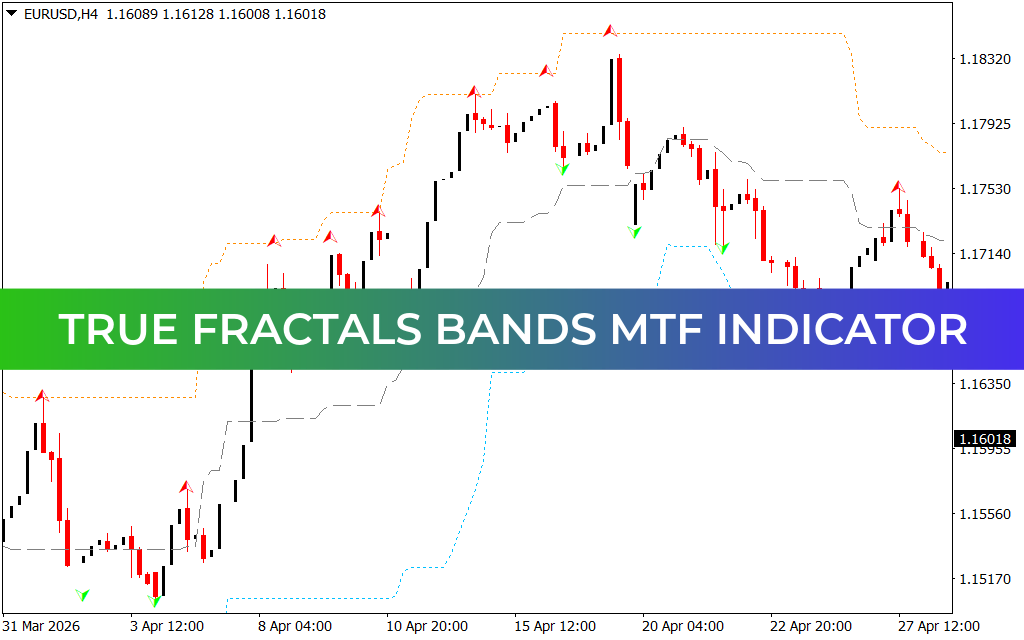
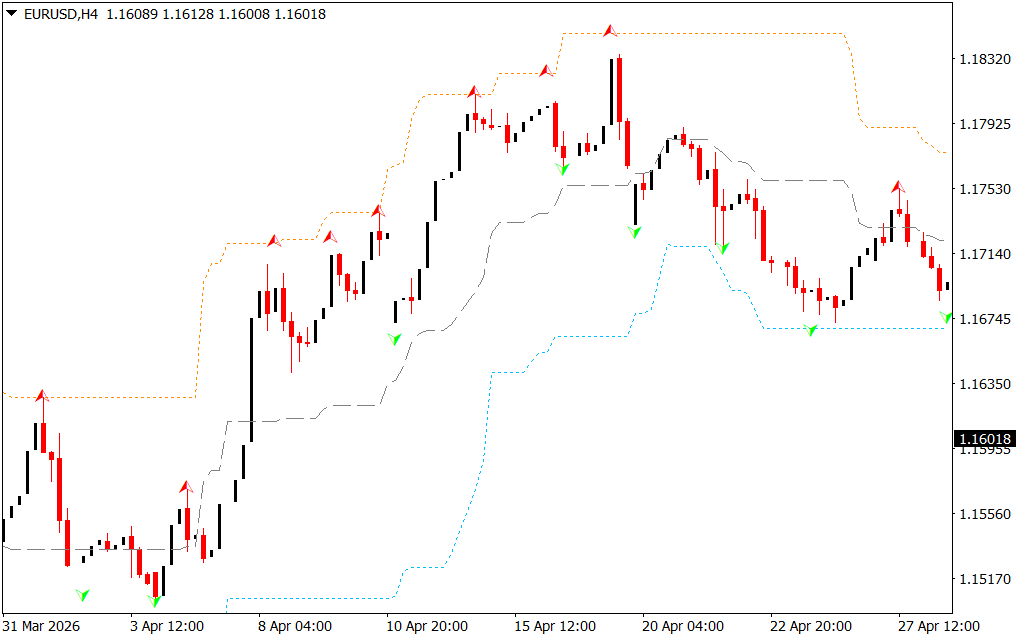
As demonstrated on the 4-hour ($H4$) EUR/USD chart, the software creates a clean, three-tiered technical layout that continuously tracks institutional order blocks:
- The Upper Resistance Envelope (Orange Stepped Line): Mapped along verified historical swing highs, this upper band highlights major distribution ceilings. Upward-pointing red arrows trigger along this boundary, alerting technical analysts to potential trend exhaustion points.
- The Lower Support Envelope (Blue Stepped Line): Drawn across historical swing lows, this baseline marks primary accumulation zones. Downward-pointing green arrows track this floor, spotlighting high-probability bounce zones.
- The Central Equilibrium Filter (Grey Stepped Line): Running through the center of the channel, this median line acts as a dynamic trend pivot. When price action remains above the grey baseline, the immediate Market Structure retains a bullish bias; when it drops below, market control shifts to the bears.
Implementing Rule-Based Execution Strategies
Integrating the multi-timeframe capabilities of the True Fractals Bands MTF indicator into your daily charting workspace helps establish an completely objective trading routine.
1. Trading the Channel Rejection (Mean Reversion)
During typical consolidation phases, price naturally oscillates between the upper and lower bands. When an asset rallies into the orange resistance line, stalls, and prints a red fractal arrow, it provides a low-risk entry for a short position. Traders can confidently target the central grey line or the opposing blue support envelope as logical take-profit milestones.
2. Capitalizing on Multi-Timeframe Breakouts
Because this tool features MTF capabilities, traders can overlay higher-timeframe fractal bands onto lower-timeframe execution charts. If a candle closes decisively outside an upper orange band on a macro interval, it signals a major structural breakout. This alignment allows trend-following traders to aggressively search for continuation setups on minor pullbacks.
Conclusion
The True Fractals Bands MTF indicator is an invaluable technical upgrade for analysts who prioritize Price Action geometry and visual clarity. By replacing standard lagging lines with math-driven, step-like volatility channels, it eliminates guesswork from daily range analysis. Download the tool today to optimize your MetaTrader platform and trade with mechanical precision.
8 Downloads
Last Update:
May 20, 2026 02:06 AM
Published:
Jan 19, 2026 07:52 AM
Category: