The Two Lines Indicator MT4 is a simple yet effective forex trading tool designed for traders who want clear and actionable trend signals on the MetaTrader 4 platform. This free indicator is especially popular among beginners and intermediate traders because it visually highlights potential trend changes using only two lines. By focusing on fast and slow line crossovers, traders can quickly identify bullish and bearish market conditions without overcomplicating their charts.
Thanks to its simplicity and flexibility, the Two Lines Indicator MT4 is suitable for various trading styles and market conditions.
What Is the Two Lines Indicator
The Two Lines Indicator is a trend-following technical indicator that consists of:
A fast line, which reacts quickly to price changes
A slow line, which represents broader market direction
The interaction between these two lines provides traders with clear signals about potential trend shifts and momentum changes.
How the Indicator Works
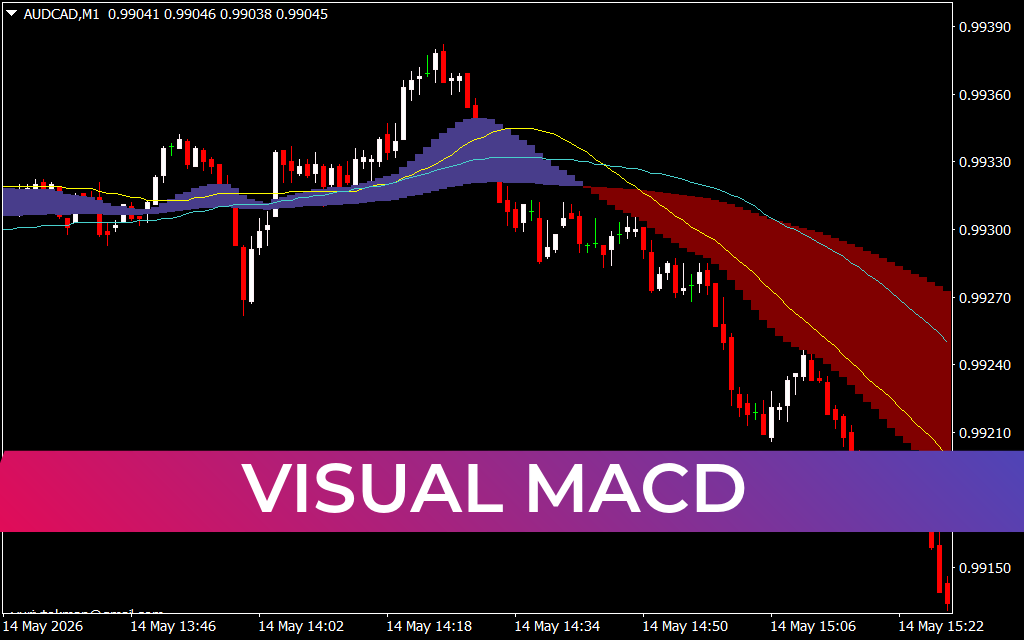
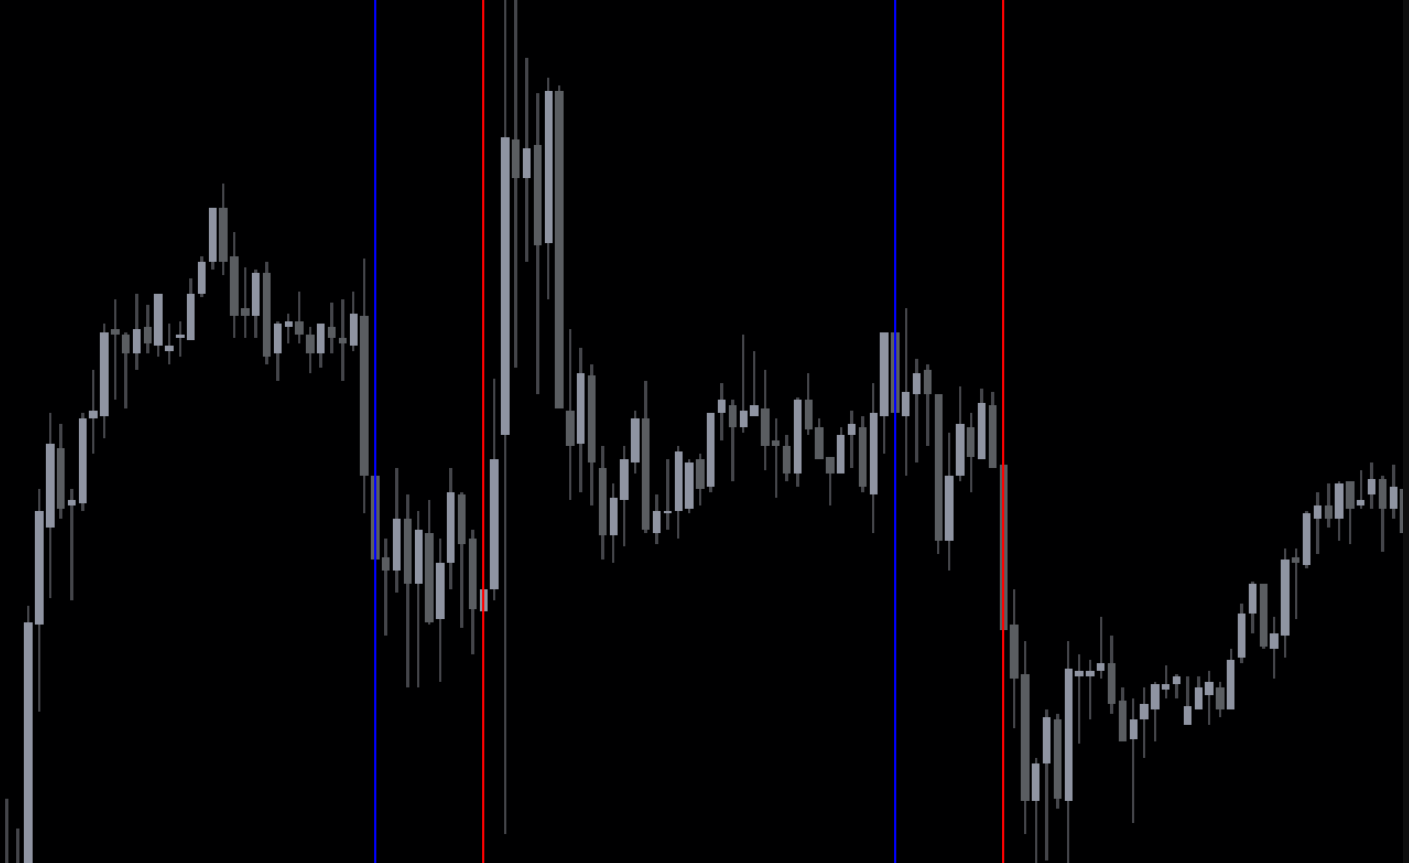
The Two Lines Indicator MT4 analyzes price movement and plots two lines that move relative to each other on the chart.
Signal Logic
When the fast line crosses above the slow line, it indicates bullish momentum
When the fast line crosses below the slow line, it st.com/items/3-bars-high-lowbearish momentum
These crossover points help traders determine optimal entry and exit moments in trending markets.
Bullish and Bearish Trading Signals
The indicator makes trend identification straightforward.
Bullish Market Signals
Fast line crosses above slow line
Upward price momentum increases
Buying opportunities may appear
Bearish Market Signals
Fast line crosses below slow line
Downward momentum strengthens
Selling opportunities become more favorable
Traders often wait for candle confirmation before entering trades to reduce false signals.
Using the Indicator for Trend Confirmation
Beyond entry signals, the Two Lines Indicator MT4 is useful for trend confirmation.
Lines moving upward together suggest a strong uptrend
Lines moving downward confirm a downtrend
Flat or frequently crossing lines indicate ranging markets
This allows traders to avoid low-probability trades during sideways conditions.
Best Trading Strategies with Two Lines Indicator
The indicator can be used in multiple trading approaches.
Trend Following Strategy
Enter trades in the direction of the crossover
Hold positions while lines remain separated
Exit when opposite crossover appears
Confirmation Strategy
Combine with Support And Resistance levels
Use alongside momentum or volatility indicators
Confirm entries using Price Action patterns
This combination improves accuracy and trade confidence.
Customization Options
The Two Lines Indicator MT4 allows traders to adjust:
Line colors
Line thickness
Calculation periods
These settings help adapt the indicator to different timeframes and personal trading styles.
Advantages of Two Lines Indicator MT4
Free and easy to install
Clear visual signals
Reduces chart clutter
Works across all timeframes
Suitable for beginners and advanced traders
Its simplicity makes it ideal for traders who prefer clean and efficient analysis.
Conclusion
The Two Lines Indicator MT4 is a reliable and beginner-friendly trading tool that helps traders identify trends and potential entry points with minimal complexity. By focusing on fast and slow line crossovers, it delivers clear bullish and bearish signals that can enhance trading consistency.
👉 Visit IndicatorForest.com to explore more free MT4 indicators, professional trading tools, and expert trading guides designed to improve your forex trading results.
FAQ
TWO Lines plots two key lines on the chart that help identify trend direction and potential trading opportunities. These lines typically represent dynamic support and resistance levels that adapt to market conditions.
When price is above both lines, it indicates a strong uptrend. When price is below both lines, it suggests a strong downtrend. Price between the lines may indicate consolidation or a potential trend change.
Enter long trades when price bounces off the lower line in an uptrend, enter short trades when price bounces off the upper line in a downtrend, trade breakouts when price moves beyond both lines, and use line crossovers as trend change signals.
The simplicity makes it easy to understand and use, reduces chart clutter, provides clear visual signals, and helps traders focus on key levels without information overload.
Combine with momentum oscillators for confirmation, use with volume indicators to validate signals, integrate with candlestick patterns for entry timing, and combine with higher timeframe trend analysis.
Published:
Dec 17, 2025 11:00 AM
Category: