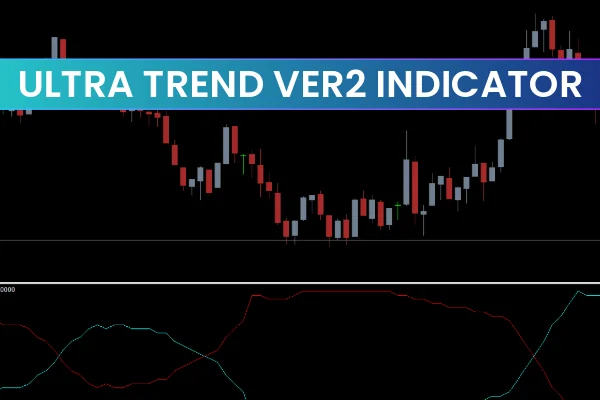
The Ultra Trend Ver2 Indicator for MT4 is a trend-following oscillator designed to help Forex traders accurately identify bullish and bearish market conditions. It comes with a built-in filter mechanism that improves the quality of trading signals and reduces false entries.
This indicator is suitable for both beginner and professional traders, allowing them to analyze trend direction, strength, and reversals with high precision. The Ultra Trend Ver2 works especially well on higher timeframes (H1 and above), making it an excellent tool for swing and position trading.
Available now for free download at IndicatorForest.com, this tool provides clear visual insights that simplify trend detection and trade timing.
How the Ultra Trend Ver2 Indicator Works in MT4
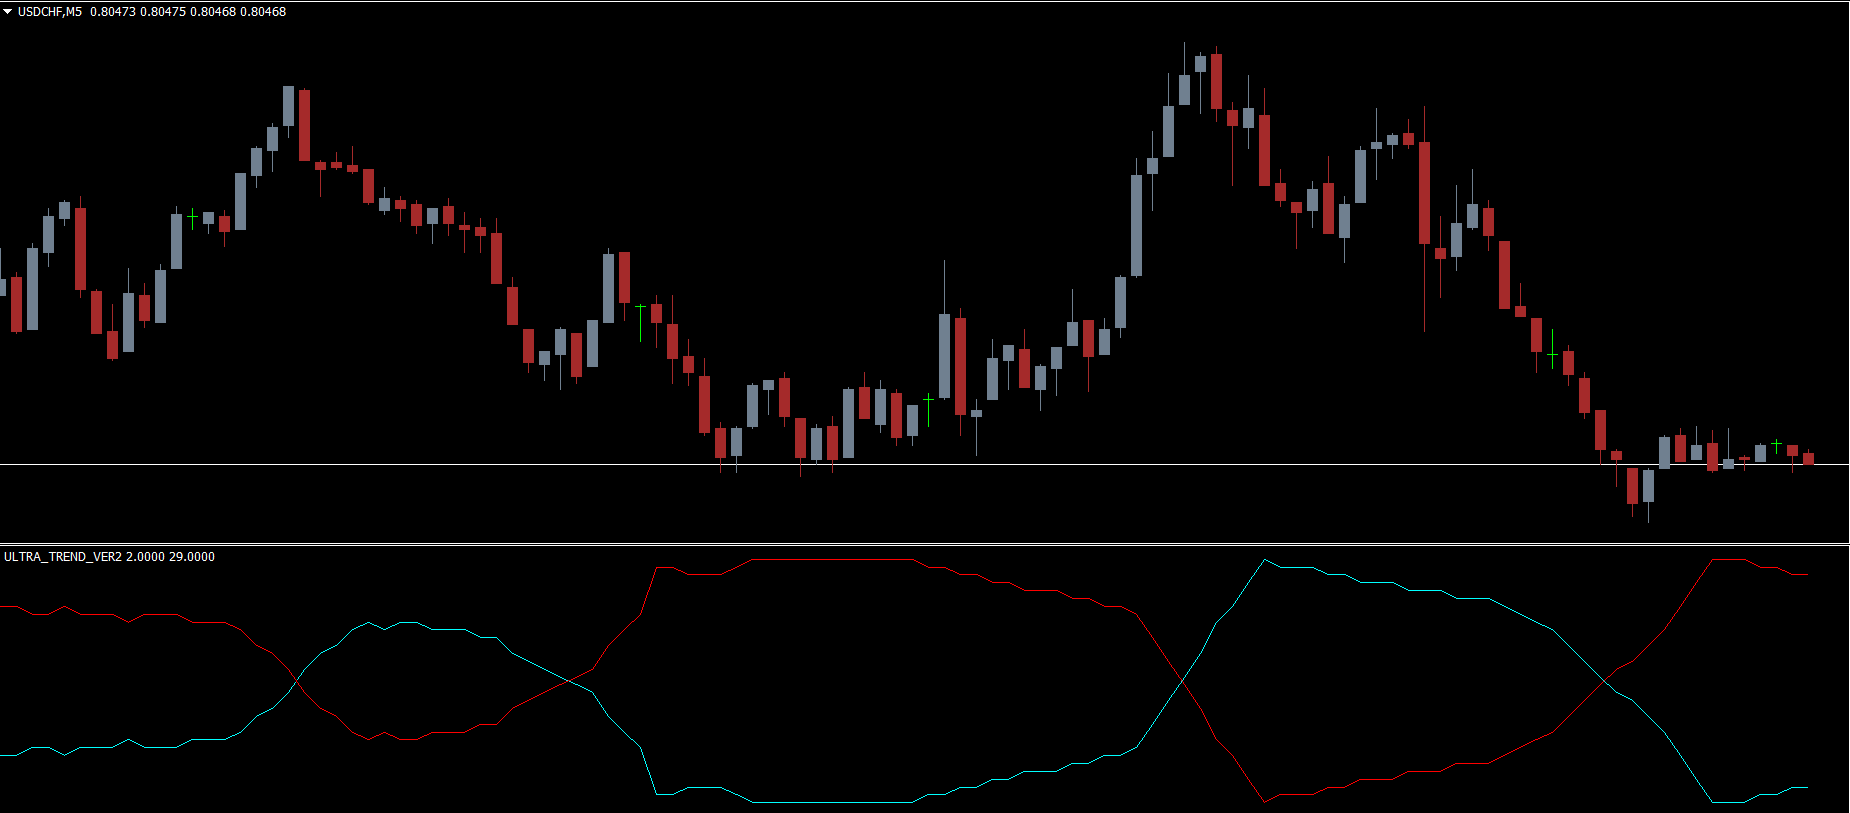
The Ultra Trend Ver2 Indicator is displayed as an oscillator in a separate chart window. It uses two dynamic lines:
Aqua Line – represents the bullish (uptrend) movement.
Red Line – represents the bearish (downtrend) movement.
When these two lines cross, it signals a potential Trend Reversal or entry opportunity. The crossover strategy is the key component of this indicator’s trading logic.
For example:
When the Aqua line crosses above the Red line, it indicates a bullish crossover. Traders should open a buy trade and place a stop loss below the previous swing low.
When the Aqua line crosses below the Red line, it signals a bearish crossover. Traders should open a sell trade and manage risk accordingly.
This crossover confirmation method reduces noise and helps traders filter out weak or false breakouts—making it more reliable than many basic oscillator systems.
Best Timeframes and Pairs for the Ultra Trend Ver2 Indicator
Although the Ultra Trend Ver2 Indicator can be used on lower timeframes (like M15 or M30), it performs best on higher timeframes (H1, H4, and D1). This is because larger timeframes help eliminate false crossovers and align better with broader market trends.
You can use this indicator on:
Major Forex pairs (EUR/USD, GBP/USD, USD/JPY)
Cross pairs (EUR/JPY, GBP/AUD)
Commodities and indices, when integrated with MT4 brokers supporting CFD trading.
By combining this indicator with support/resistance zones or Price Action analysis, traders can further enhance accuracy and profitability.
Ultra Trend Ver2 Indicator Trading Strategy (Step-by-Step)
Attach the indicator to your MT4 chart (preferably H1 or higher).
Wait for a crossover:
Aqua crosses above Red → Buy signal.
Aqua crosses below Red → Sell signal.
Set stop loss:
For buy trades → below recent swing low.
For sell trades → above recent swing high.
Take profit:
Exit when the opposite crossover occurs.
Alternatively, trail your stop for longer-term trends.
💡 Pro Tip: Combine Ultra Trend Ver2 with the Candle Direction Indicator to confirm trend bias across multiple timeframes.
Advantages of Using the Ultra Trend Ver2 Indicator for MT4
Reliable Trend Detection: Clearly distinguishes bullish and bearish phases.
Built-in Filtering System: Minimizes false entries caused by market noise.
Multi-Timeframe Application: Works best on H1–D1 charts for long-term accuracy.
Simple to Use: Ideal for beginners who prefer visual clarity.
Flexible Use: Compatible with any Forex pair, index, or CFD instrument.
This indicator simplifies trend-following trading, making it easier to execute well-timed entries and exits.
Conclusion
The Ultra Trend Ver2 Indicator for MT4 is a powerful oscillator-based trend tool designed to help traders identify and confirm market direction with confidence. It provides clear buy/sell signals using line crossovers while filtering out weak movements for better accuracy.
For trend followers and swing traders, it’s an essential tool to strengthen technical setups and confirm directional bias.
👉 Download the Ultra Trend Ver2 Indicator for free at IndicatorForest.com and start improving your Forex trading results today!
FAQ
Published:
Nov 10, 2025 14:09 PM
Category: