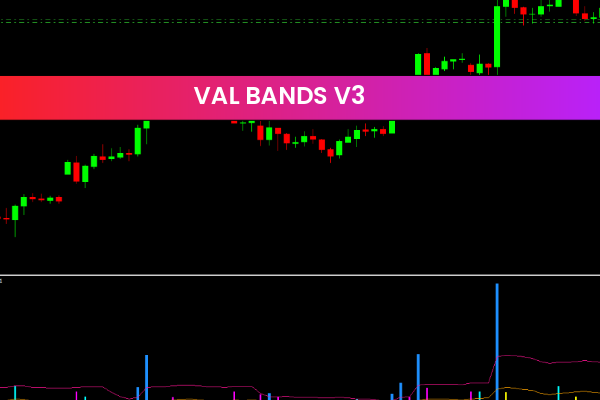
The Val Bands V3 Indicator for MT4 is a unique technical analysis tool designed to measure the length of candlesticks and plot Bollinger Bands based on that data. It visualizes candle strength through a colored histogram, allowing traders to detect flat market conditions and the start of bullish or bearish trends effectively.
Unlike typical volatility indicators, Val Bands V3 analyzes candlestick body length rather than price deviation. This makes it particularly useful for traders who want to confirm market momentum before entering or exiting a trade. Whether you’re a beginner or an experienced trader, this indicator simplifies decision-making with clear visual cues.
How the Val Bands V3 Indicator for MT4 Works
Candle Length and Bollinger Bands
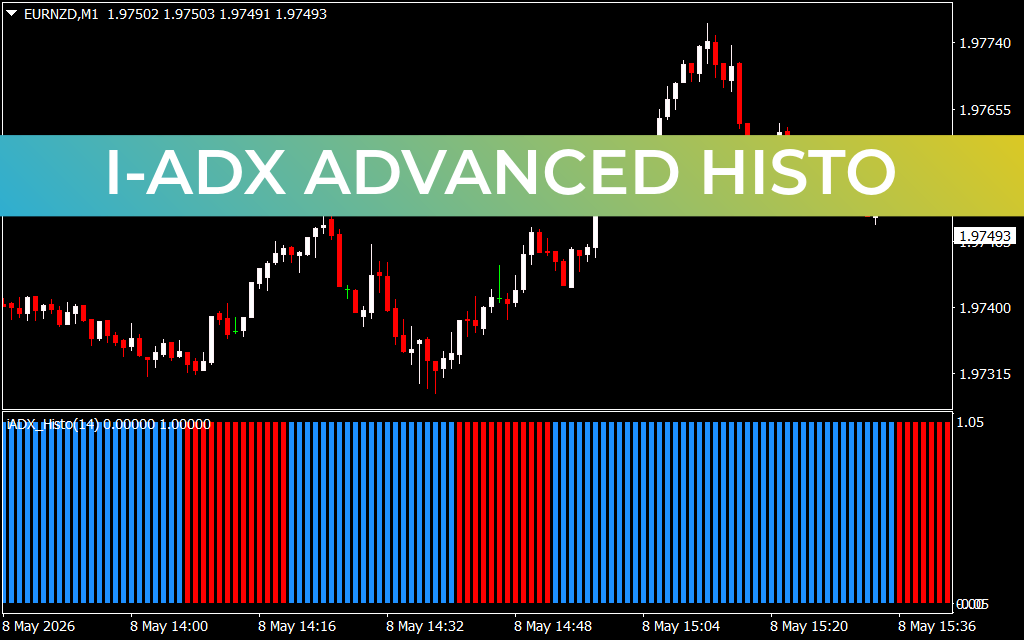
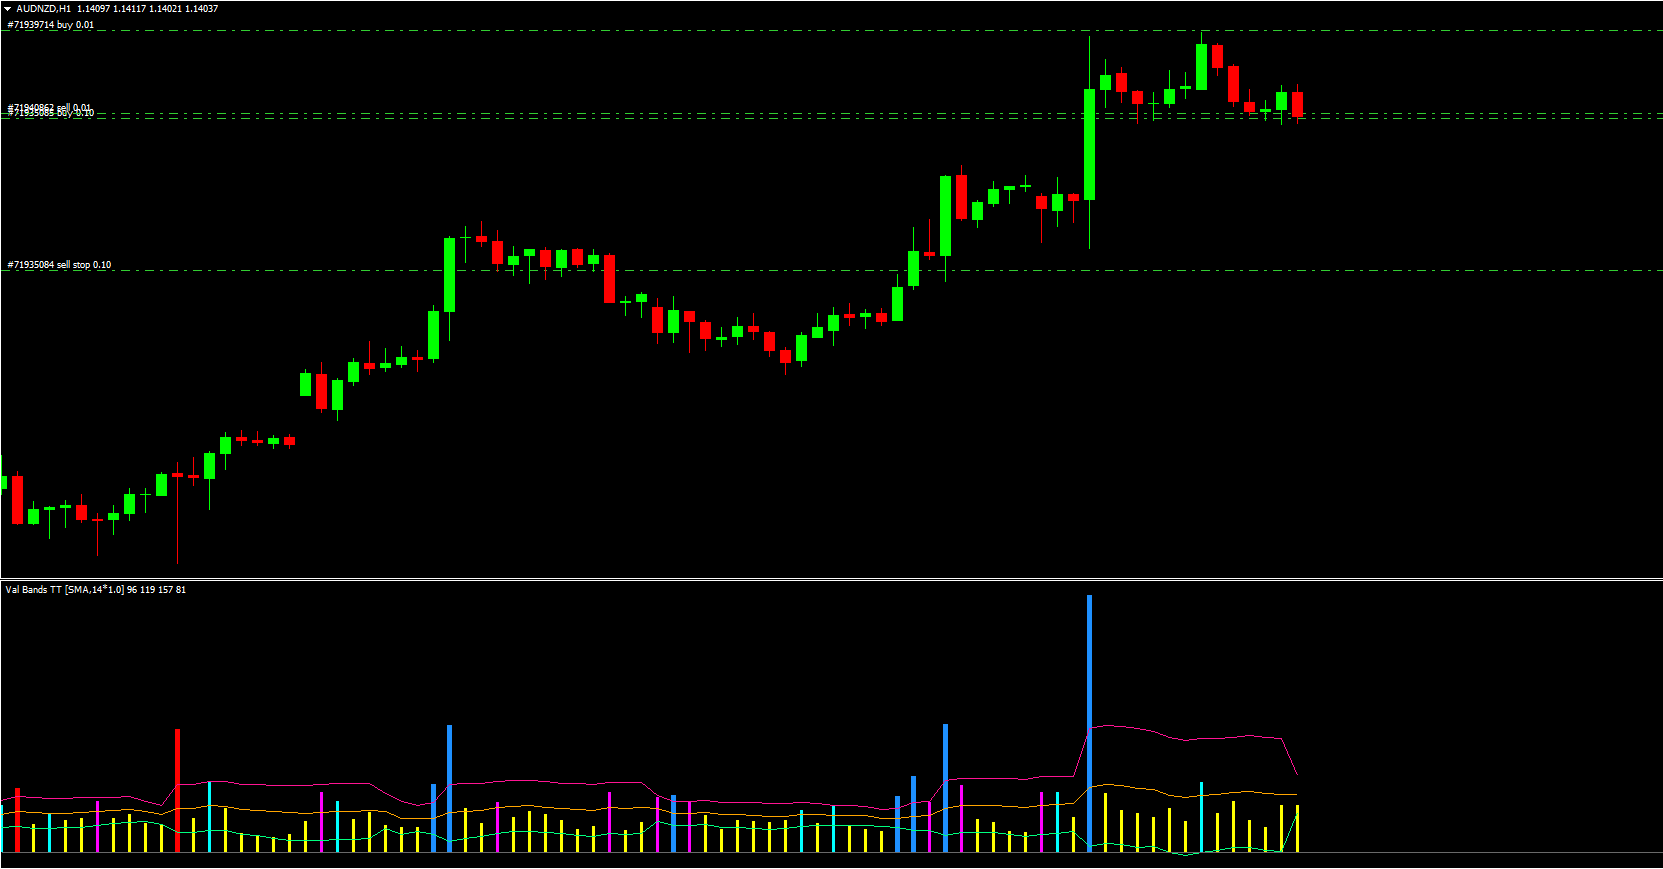
The indicator plots three Bollinger Bands over the histogram that represent the average candle length. The histogram bars indicate the current candle length, while the bands define whether the market is neutral or trending.
Yellow bars: Flat or neutral market phase.
Blue bars: Bullish market signal.
Red bars: Bearish market signal.
When histogram bars move from the lower Bollinger band to the upper band, it signals a trend initiation. The color change helps traders easily spot market shifts without complex calculations.
Trading Signals and Strategy
Bullish Signal
A blue histogram bar signals a buy opportunity. Traders can open a long position once the first blue bar appears, placing a stop-loss below the previous swing low. Profits can be taken when an opposite (red) signal appears.
Bearish Signal
A red histogram bar indicates a sell opportunity. Traders can open short positions following the red bar, with a stop above the previous swing high and an exit at the next opposite signal.
This simplicity makes the Val Bands V3 Indicator for MT4 ideal for Scalping, swing trading, and day trading strategies.
Advantages of Using the Val Bands V3 Indicator
Easy-to-read visuals: Color-coded histograms make signal detection effortless.
Adaptable: Works on all timeframes and currency pairs.
Reliable confirmations: Combines Bollinger band theory with candlestick analysis.
Perfect for trend traders: Helps identify when trends begin and end.
When integrated with other confirmation tools such as RSI or MACD, the indicator’s reliability increases even further.
How to Use and Download the Val Bands V3 Indicator
Installing the Val Bands V3 Indicator is simple:
Download the indicator file from IndicatorForest.com.
Copy the file into your MT4 “Indicators” folder.
Restart MetaTrader 4 and attach the indicator to your preferred chart.
Customize colors and settings as needed for better visibility.
Once set up, traders can instantly visualize market trends, flat zones, and reversal points.
Pro Tips for Maximum Efficiency
Combine Val Bands V3 with trendline analysis or moving averages for confirmation.
Avoid entering trades during yellow histogram periods, as they represent low momentum.
Test the indicator on a demo account before applying it in live trading.
Conclusion
In summary, the Val Bands V3 Indicator for MT4 is an essential forex trading tool that utilizes candle length and Bollinger Bands to pinpoint market direction and trend reversals. Its color-coded histogram provides clear, actionable insights for traders of all experience levels.
Download the Val Bands V3 Indicator today from IndicatorForest.com and take your trend analysis to the next level.
1 Download
Published:
Jan 03, 2026 06:55 AM
Category: