Redefining Relative Value with Value Charts for MT4 and MT5
In the world of technical analysis, traders often struggle to distinguish between a market that is simply "high" and a market that is truly "overvalued." Traditional indicators like the RSI or Stochastics measure momentum, but they often fail to account for the actual price range relative to historical volatility. Value Charts solve this problem by detaching price from its vertical axis and re-plotting it in a standardized valuation window. This allows traders to identify extreme price levels with institutional-grade accuracy.
What are Value Charts?
Created by Mark Helweg and David Stendahl, Value Charts are designed to show the "fair value" of an asset. Unlike a standard price chart where the Y-axis represents the exchange rate (such as 1.1780 for EURUSD), Value Charts display price on a scale usually ranging from -10 to +10.
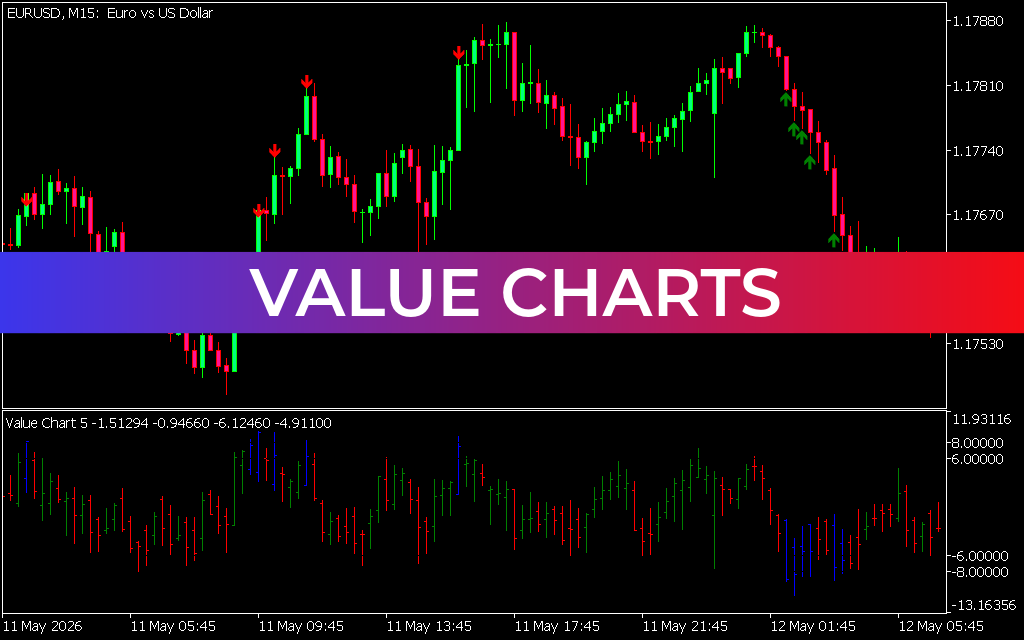
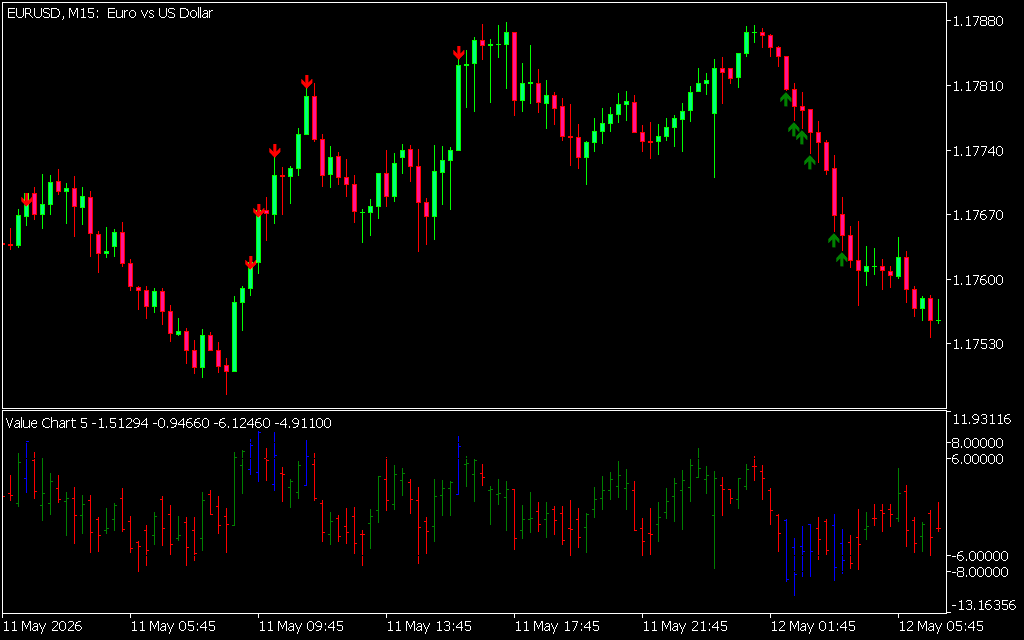
As seen in the EURUSD M15 example, the indicator appears in a separate sub-window. It visualizes individual candlesticks based on their valuation. When a bar extends into the extreme upper zones (above +6 or +8), the asset is considered significantly overvalued. Conversely, when bars dip into the lower zones (below -6 or -8), the asset is undervalued.
Identifying High-Probability Reversals
The primary strength of Value Charts lies in their ability to highlight "valuation extremes." In a standard trending market, price can continue to climb for days, causing momentum oscillators to stay "overbought" and trap traders into premature short positions.
Value Charts act differently. Because they normalize price, they pinpoint exactly when a move has stretched too far beyond its statistical norm. In the provided chart, the red and green arrows on the main price screen correspond with the Value Chart hitting these extreme levels.
- Overvalued (Sell Signals): When the Value Chart bars turn blue or reach the upper boundary, it signals a high probability of a mean-reversion move to the downside.
- Undervalued (Buy Signals): When the bars reach the lower red zones, it indicates that selling pressure is exhausted and a bullish bounce is likely.
Strategic Implementation: Trend vs. Range
While Value Charts are exceptional at finding tops and bottoms in ranging markets, they are equally powerful trend-following filters. A professional trader doesn't just look for an extreme; they look for a "valuation divergence." If price makes a new high but the Value Chart shows a lower high, it’s a clear warning that the trend is losing its fundamental backing.
For day traders on the M15 timeframe, Value Charts provide a "sanity check." Before entering a long position, a quick glance at the indicator can tell you if you are buying at a fair price or if you are entering at a historical peak where the risk-to-reward ratio is no longer favorable.
Conclusion
Value Charts provide a unique perspective that standard Price Action cannot offer. By translating price into a standardized scale of value, they empower traders to buy low and sell high with mathematical confidence. Whether you are a mean-reversion specialist or a trend follower looking for better entries, Value Charts are an essential upgrade for any MetaTrader platform.
4 Downloads
Last Update:
May 13, 2026 13:59 PM
Published:
Jan 23, 2026 10:48 AM
Category: