Mastering Forex Trends with the Vegas V1 Indicator
In the fast-paced world of Forex trading, identifying the prevailing market trend and pinpointing high-probability reversal zones is the key to consistent profitability. Among the plethora of technical tools available to traders, the Vegas V1 Indicator stands out as a robust, time-tested system designed to smooth out market noise and map institutional money flows. By utilizing a unique combination of moving averages and Fibonacci-based envelope bands, this indicator provides day traders and swing traders alike with a structured roadmap for the charts.
Understanding the Vegas V1 Architecture
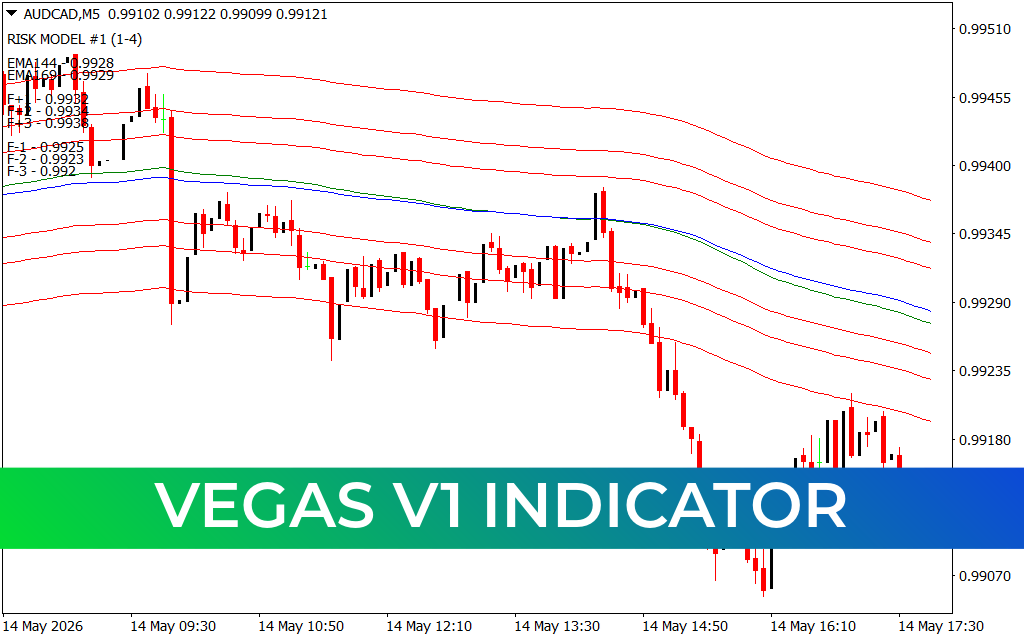
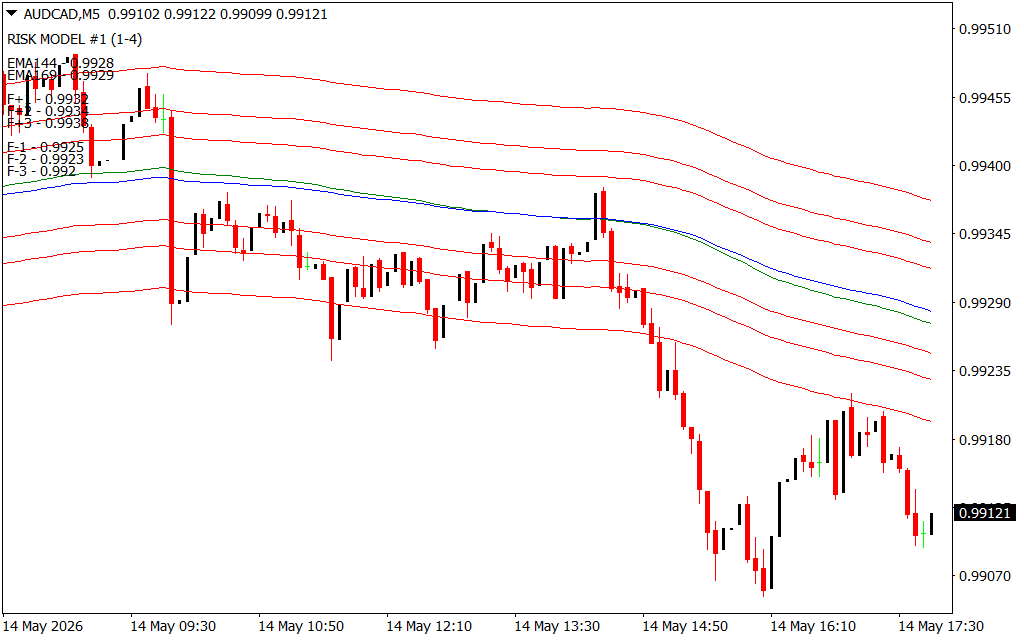
The Vegas V1 Indicator is built upon a foundation of Exponential Moving Averages (EMAs) and dynamic channel lines. At its core, the indicator utilizes a central "tunnel" formed by two primary EMAs—typically the 144 EMA and the 169 EMA. These specific periods are derived from the Fibonacci sequence and are widely recognized by institutional algorithms as critical Support And Resistance thresholds.
Surrounding this central tunnel are multiple outer bands, often labeled as Fibonacci extensions (such as F+1, F+2, F-1, F-2, etc.). These bands act as dynamic overbought and oversold boundaries. When the price accelerates aggressively away from the central tunnel and hits these outer boundaries, it signals that the market is overextended, flagging high-probability areas for retracements or trend reversals.
How to Trade with Vegas V1
The beauty of the Vegas V1 system lies in its dual functionality: it serves as both a trend-following tool and a mean-reversion roadmap.
- Trend Identification: When the price consistently holds above the 144 and 169 EMA tunnel, the market is in a confirmed bullish trend. Conversely, when the price breaks and sustains below the tunnel, a bearish markdown phase is underway. The slope of the tunnel itself provides an instant visual cue regarding Trend Strength.
- Trade Execution: Successful traders look for "tunnel retests." In a strong downtrend, the price will periodically rally back up toward the central red and blue EMA lines. When Price Action stalls at the tunnel and prints a bearish candlestick pattern, it offers a low-risk, high-reward short entry.
- Targeting and Risk Management: The outer Fibonacci bands serve as natural take-profit zones. If you enter a short trade at the tunnel, your primary targets are the lower bands (F-1, F-2). Stop-losses are safely tucked just on the opposite side of the central tunnel, keeping risk exceptionally tight.
Optimizing Across Timeframes
While the Vegas V1 Indicator is highly effective on a 5-minute (M5) chart for fast-paced Scalping and intraday setups, it truly shines when aligned with higher-timeframe trends. For the best results, traders should check the hourly (H1) or 4-hour (H4) charts to establish the macro direction, and then use the M5 or M15 charts to execute precise, low-risk entries using the Vegas V1 bands.
2 Downloads
Last Update:
May 14, 2026 20:54 PM
Published:
Jan 22, 2026 01:34 AM
Category: