The Velocity Indicator for MT5 measures the average rate at which the price of a financial instrument increases or decreases over a selected period. It helps traders understand how fast or slow the market is moving at any point in time. Although similar in principle to momentum and speed indicators, the Velocity Indicator is unique in how it displays price acceleration.
While a Momentum Indicator measures the strength or weakness of an asset’s movement, and volatility indicators measure price fluctuation intensity, the Velocity Indicator specifically focuses on market speed. It calculates how quickly price travels in a bullish or bearish direction, providing direct insight into the pace of the market.
How the Velocity Indicator Works
The Velocity Indicator presents its data using a histogram that moves above and below a zero line. This visual format allows traders to quickly interpret market conditions:
Histogram above zero: bullish velocity
Histogram below zero: bearish velocity
The height of each bar represents the speed of price movement:
Longer bars = slower price movement
Shorter bars = faster price movement
This may seem counterintuitive at first, but the indicator reflects average velocity over the period. When price movement slows, the histogram bar extends, showing reduced velocity but heightened visibility of direction.
Difference Between Velocity, Momentum, and Volatility Indicators
It’s important to understand how the Velocity Indicator differs from related tools:
Velocity Indicator
Measures how fast price moves in a given direction. Shows bullish/bearish speed as histogram values.
Momentum Indicator
Measures the strength of movement, not the speed. A strong momentum reading means a strong push by buyers or sellers.
Volatility Indicator
Measures the range of price fluctuation, helping traders identify breakout conditions or market uncertainty.
In short:
Velocity = speed
Momentum = strength
Volatility = price range
How to Use the Velocity Indicator in MT5
The Velocity Indicator does not generate direct buy or sell signals. Instead, it serves as a confirmation tool that traders use alongside Price Action, trend analysis, chart patterns, and other technical indicators.
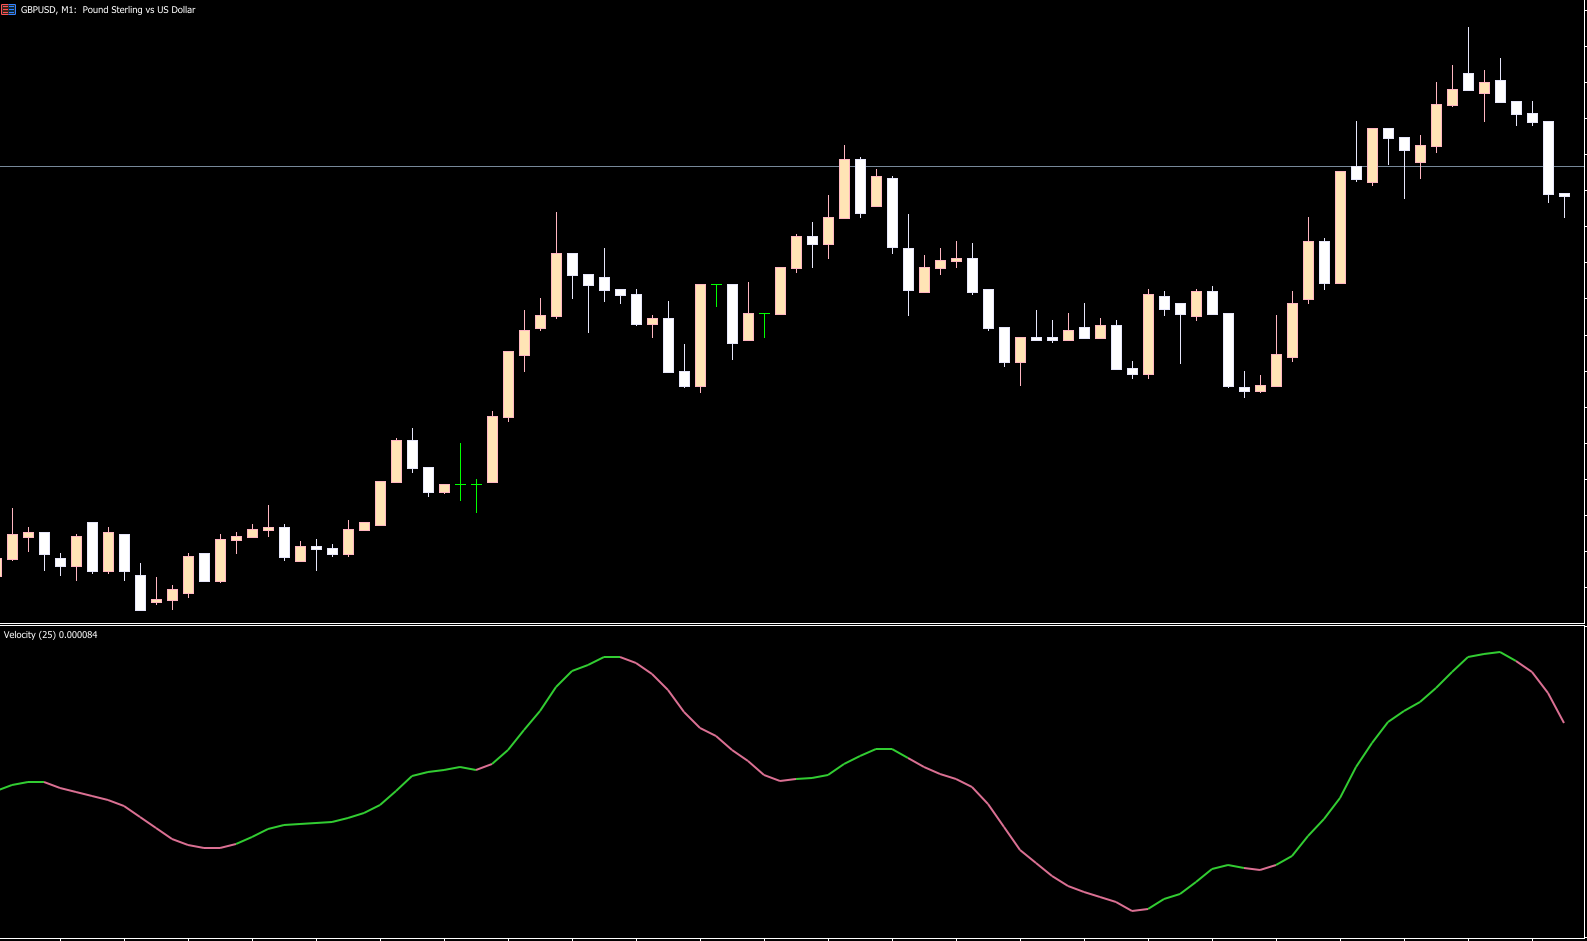
Understanding Histogram Colors
Green histogram: bullish speed (supports buy bias)
Pink histogram: bearish speed (supports sell bias)
These colors do not represent automatic trading signals. Instead, they help traders validate ongoing market direction.
Practical Trading Applications
Identifying Trend Strength
When the histogram shows consistent values above zero, it suggests stable bullish velocity. Similarly, repeated negative values indicate steady bearish velocity. This helps traders confirm whether a trend is strong or weakening.
Detecting Slowdowns Before Reversals
If histogram bars begin to shrink, it suggests rising market speed. If they begin to stretch, it indicates price is slowing down. Sudden slowdowns often occur before pullbacks or full reversals.
Combining Velocity with Other Indicators
Because the Velocity Indicator works best as a supporting tool, traders commonly pair it with:
Moving averages for trend direction
Volume Profile indicators for market participation
Support And Resistance zones for reversal confirmation
Price action patterns (pin bars, engulfing candles)
Algorithmic trading systems for automated filtering
This enhances accuracy and reduces false market interpretations.
Example: Using Velocity on EUR/USD (H1)
When applied to EUR/USD on the H1 timeframe, traders can observe histogram bars shifting above and below zero.
Tall green bars: slow but bullish movement
Short green bars: fast bullish acceleration
Tall pink bars: slow bearish movement
Short pink bars: fast bearish acceleration
These readings help traders interpret market speed before making decisions.
Conclusion
The Velocity Indicator for MT5 is a valuable tool for analyzing the bullish or bearish velocity of any financial asset. By measuring the speed of price movement over specific timeframes, it provides clear insight into how quickly the market is moving. While it does not directly generate buy or sell signals, it becomes highly effective when combined with price action and other technical tools.
For more MT4/MT5 indicators and trading resources, visit IndicatorForest.com.
FAQ
1 Download
Published:
Dec 10, 2025 15:13 PM
Category: