Quantifying Market Exhaustion: The VKW Bands Modify V1 Indicator for MT4
In the modern financial landscape, retail traders often struggle against institutional volatility. Classic momentum oscillators like the Relative Strength Index (RSI) or Stochastics were engineered for stable, historical market conditions. When applied to modern, high-frequency charts, these traditional indicators frequently get trapped at extreme overbought or oversold boundaries during a sustained institutional trend. This structural flaw leads to premature counter-trend entries and severe drawdown. The VKW Bands Modify V1 indicator solves this limitation by wrapping dynamic, step-calculated volatility floors and ceilings around a highly optimized momentum line.
Operating seamlessly in a dedicated sub-window, this precision technical tool transforms your charting platform into a definitive volume-and-variance assessment workspace.
The Architecture of Volatility-Driven Trend Mapping
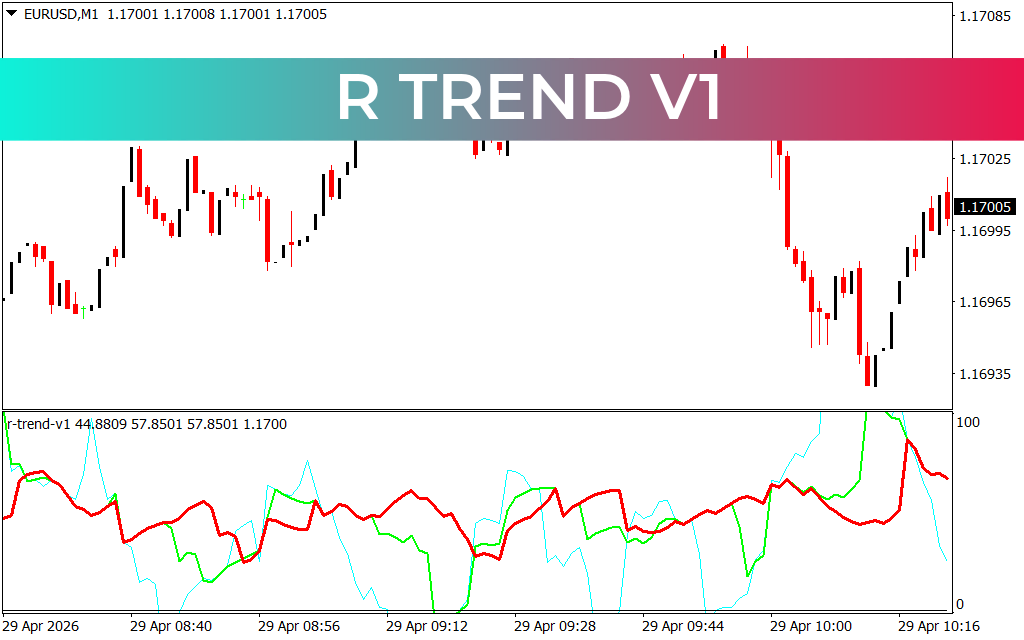
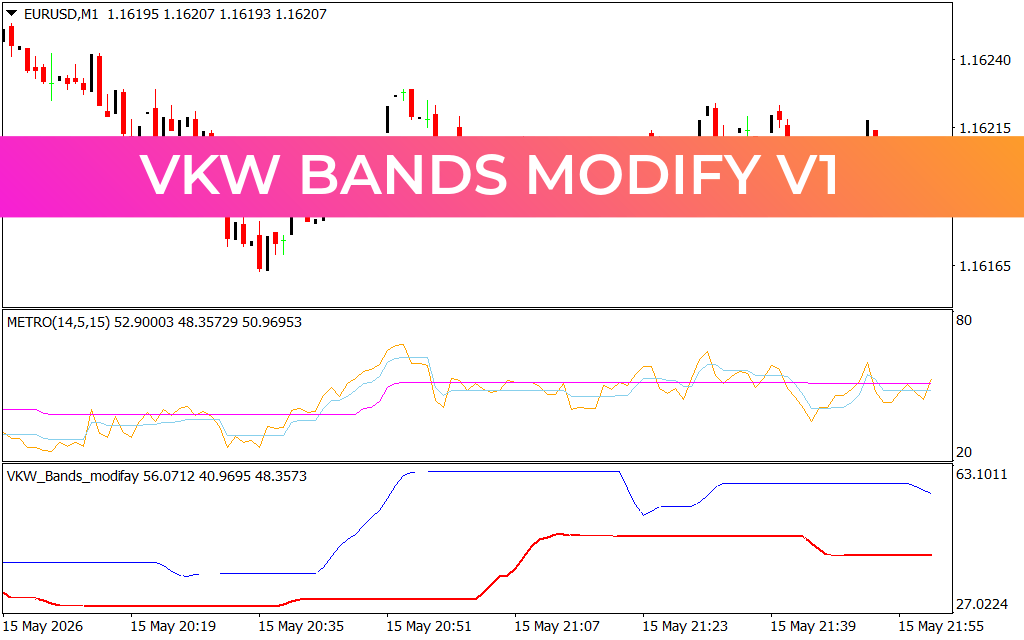
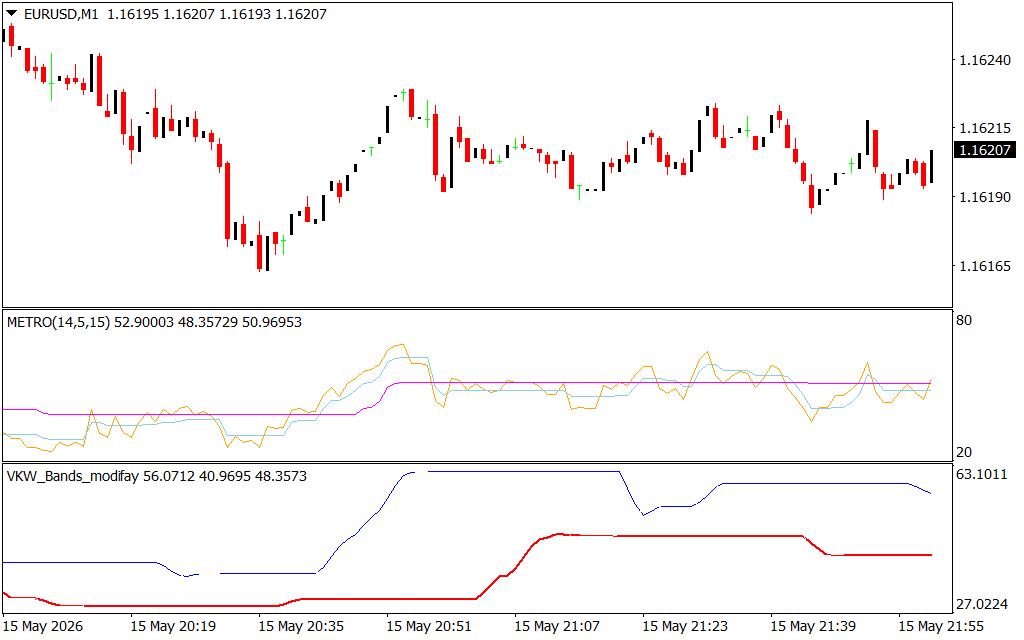
The indicator tracks structural market cycles by replacing static flat overbought/oversold levels with highly adaptive, horizontal steps that expand and contract based on true asset velocity. When loaded onto a liquid currency asset like the EUR/USD on a 1-minute (M1) chart, the system provides a clean, rule-based roadmap divided into three core elements:
- The Volatility Ceiling (The Stepped Blue Line): This upper band represents an extreme statistical deviation from baseline value. When Price Action accelerates upward and forces the internal white momentum line to touch or ride this blue ceiling, it identifies an institutional exhaustion or take-profit zone. Breakout traders look for the line to hold above this level, while mean-reversion traders watch for a downward departure.
- The Dynamic Momentum Vector (The White Tracking Line): Serving as the core oscillator, this highly responsive line tracks real-time price velocity. Its position relative to the upper and lower bands tells you exactly who controls the current Market Structure.
- The Structural Support Baseline (The Stepped Red Line): Acting as an objective floor, this line tracks major accumulation zones. When the white momentum line flattens out along this red baseline during an aggressive sell-off, it unmasks institutional absorption—signaling that big money is buying the dip and providing a strong technical signal to prepare for long reversals.
Meticulously Engineered for High-Frequency Scalping
The VKW Bands Modify V1 utility is an invaluable asset for short-term trading styles like 5-minute Scalping or rapid sixty-second micro-trades. By compressing complex mathematical variance equations into clear visual steps, it strips away the psychological guesswork often associated with volatile lower-timeframe charts.
Instead of guessing whether a sharp intraday drop is a Trend Reversal or an institutional liquidity hunt, you look at your indicator sub-window. If the white line remains anchored to the red baseline without breaking lower, the bearish momentum is exhausted. By integrating this advanced filtering tool into your MetaTrader terminal, you can confidently insulate your trading capital from market noise and ensure your execution parameters are flawlessly aligned with real-time institutional volume.
2 Downloads
Last Update:
May 17, 2026 16:40 PM
Published:
Jan 20, 2026 16:33 PM
Category: