Mastering Market Momentum with the Volatility Adjusted WPR Indicator
In the fast-paced world of Forex trading, precision is everything. Financial markets constantly shift between periods of high volatility and quiet consolidation, often leaving traditional momentum indicators prone to false signals. To overcome this limitation, advanced technical analysts turn to the Volatility Adjusted WPR (Williams Percent Range) indicator—a powerful, dynamic tool designed to filter out market noise and capture high-probability reversals.
What is the Volatility Adjusted WPR?
The standard Williams Percent Range ($%R$) is a popular oscillator that measures overbought and oversold market conditions by comparing a security’s closing price to its high-low range over a specific period. However, traditional WPR uses fixed thresholds (typically $-20$ and $-80$), which can fail during strong, volatile trends where prices remain overextended for long periods.
The Volatility Adjusted WPR solves this flaw by integrating volatility filters, such as standard deviation or Average True Range (ATR) metrics. Instead of relying on static boundaries, this indicator dynamically adjusts its calculations based on current market expansion and contraction. When the market experiences sudden spikes, the indicator scales its sensitivity, ensuring that traders only respond to genuine momentum shifts rather than temporary retracements.
How It Enhances Your Technical Analysis
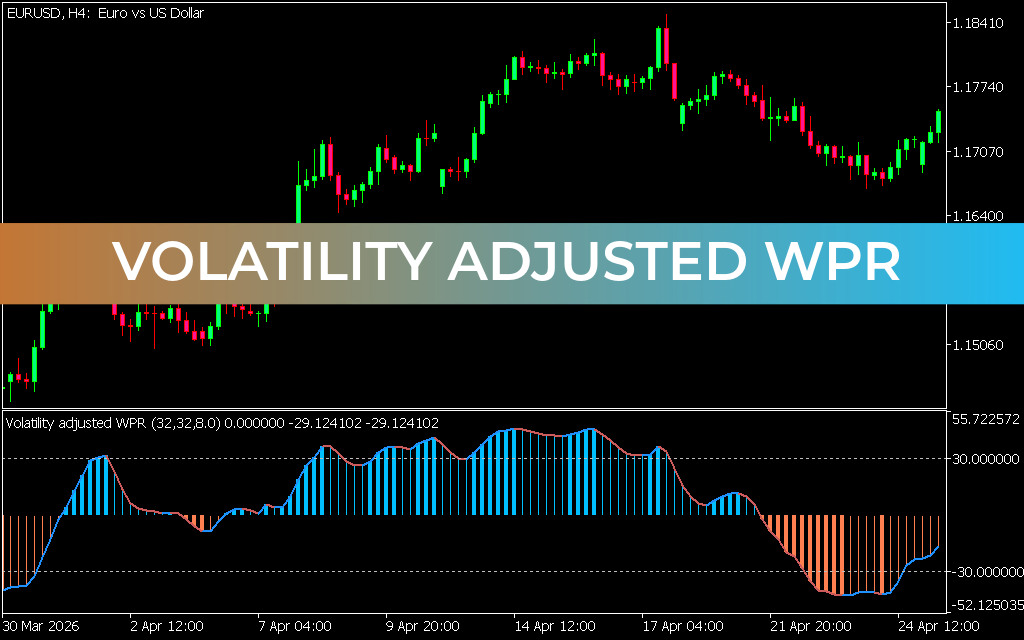
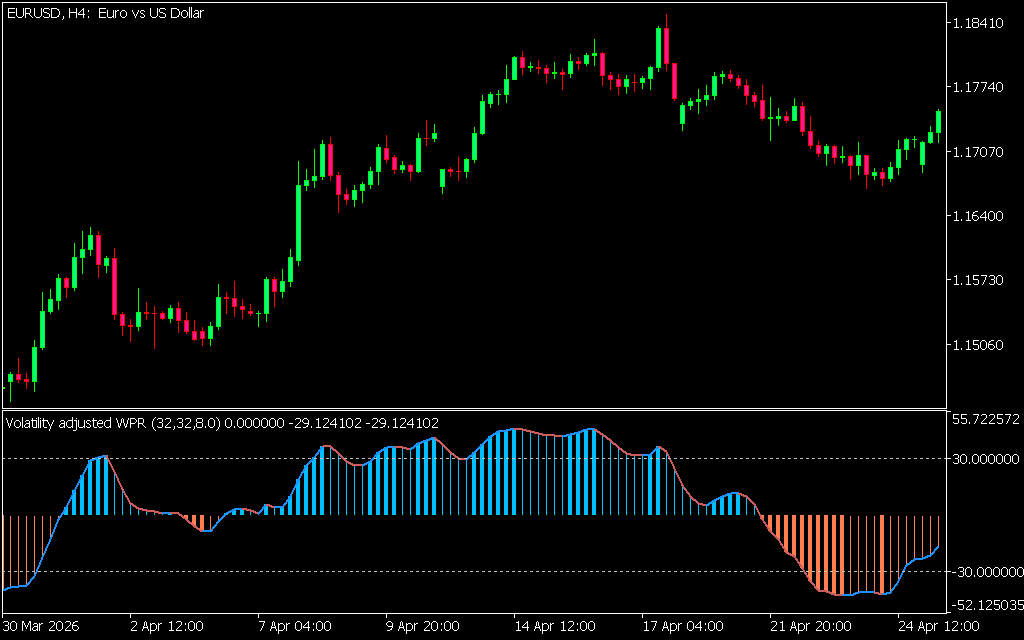
As seen on a standard 4-hour (H4) chart for major currency pairs like the EUR/USD, the Volatility Adjusted WPR translates complex market math into an intuitive, visual histogram.
- Bullish Momentum (Blue Histograms): When the indicator moves above its zero or baseline and prints blue bars, it signals that buyers are firmly in control. The heights of the bars reflect the strength of the trend, allowing traders to comfortably ride the upward momentum.
- Bearish Momentum (Orange Histograms): Conversely, a shift below the baseline accompanied by orange bars highlights aggressive selling pressure.
- Dynamic Reversals: The smoothed signal line running across the histogram acts as an early warning system. When the bars begin to shrink and the signal line crosses back toward the center, it warns traders of fading momentum—providing a perfect cue to secure profits or prepare for a counter-trend setup.
Key Trading Strategies
To maximize the efficacy of the Volatility Adjusted WPR, consider deploying it within a structured trading framework:
- Trend Following: Look for alignment across multiple timeframes. If the daily chart shows a strong uptrend, utilize the H4 Volatility Adjusted WPR to time your entries on pullbacks. Enter long positions precisely when the histogram transitions from orange back to blue.
- Volatility Breakouts: During tight consolidation phases, the histogram bars shrink close to the midline. A sudden explosion of tall blue or orange bars indicates a high-probability volatility breakout, allowing you to catch the macro-move early.
By adapting smoothly to changing market regimes, the Volatility Adjusted WPR bridges the gap between momentum oscillators and trend-following tools, making it an essential addition to any MT4 or MT5 trading toolkit.
37 Downloads
Last Update:
May 21, 2026 02:19 AM
Published:
Jan 18, 2026 14:17 PM
Category: