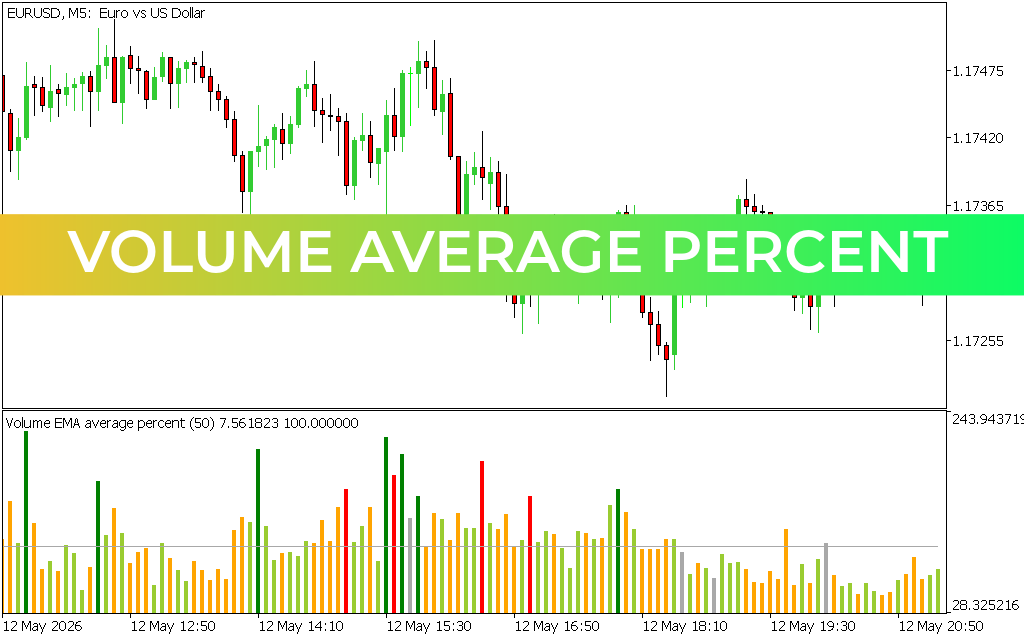
Master Market Momentum with the Volume Average Indicator for MT4
In trading, Price Action tells you what the market is doing, but volume tells you how much conviction is behind that movement. The Volume Average indicator for MetaTrader 4 (MT4) bridges this gap by combining raw trading volume with a smoothing Exponential Moving Average (EMA). This powerful combination allows day traders and scalpers to instantly distinguish true market breakouts from deceptive institutional traps.
Whether you trade forex, indices, or commodities, understanding volume context is key to increasing your strategy's win rate. Here is how the Volume Average indicator can transform your technical analysis.
How the Volume Average Indicator Works
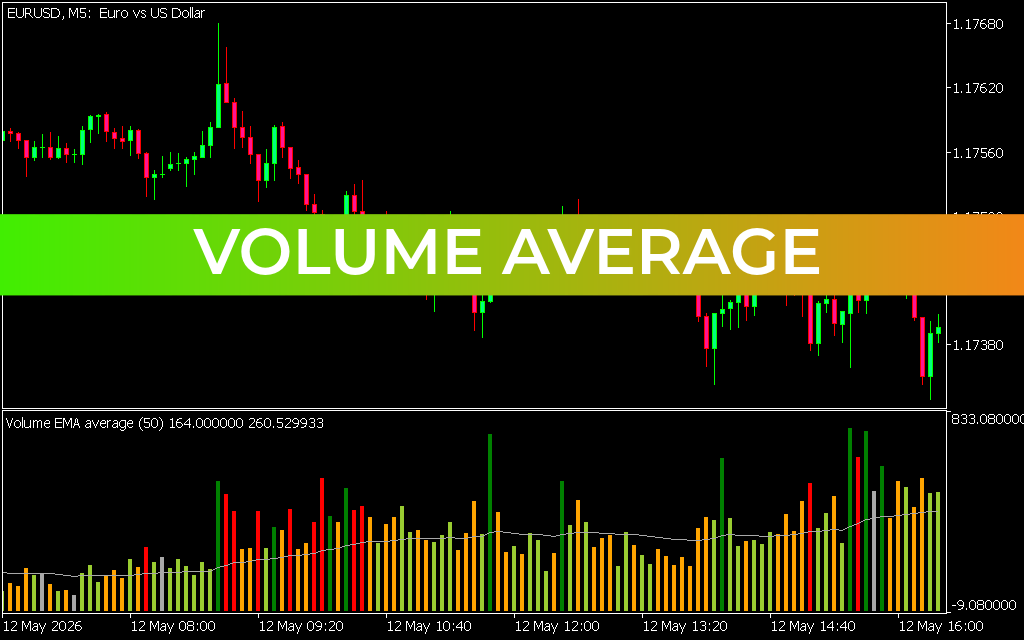
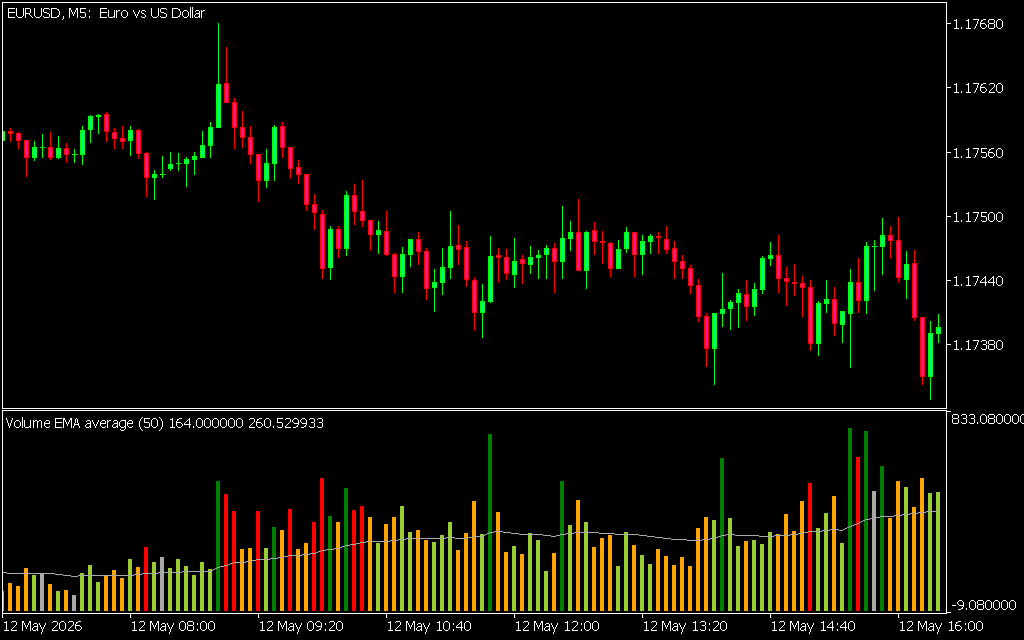
The Volume Average indicator displays as a separate sub-window below your main asset chart. It consists of two primary components:
- Color-Coded Volume Bars: These vertical bars represent the tick activity or volume within a specific timeframe (such as the M5 chart shown above). The distinct colors instantly signal whether volume is rising, falling, or stabilizing relative to recent market structures.
- The Smoothing EMA Line (Period 50): A custom moving average line runs directly through the volume bars. This line serves as the dynamic benchmark for market participation.
When the volume bars spike well above the 50-period EMA line, it confirms institutional interest and heavy institutional participation. When bars remain safely below the line, it indicates a quiet, low-liquidity environment where false breakouts are highly common.
Key Trading Strategies with Volume Average
Integrating this indicator into your daily MT4 charting setup allows you to execute higher-probability setups using two core methods:
1. Validating True Breakouts
Many traders lose capital by buying resistance breakouts that instantly reverse. With the Volume Average indicator, you look for a breakout candle on the price chart that coincides with a volume bar bursting above the moving average line. This surge confirms that major buyers or sellers are fueling the move, making it a sustainable trend.
2. Spotting Trend Exhaustion
If the price is making new highs on a 5-minute chart but the Volume Average bars are consistently shrinking and staying below the EMA line, it reveals a bearish divergence. This lack of buying pressure signals that the current bullish trend is running out of steam and a reversal may be imminent.
Why Choose the Volume Average Tool?
Standard volume histograms can look cluttered and chaotic. By introducing a 50-period EMA overlay, this indicator gives you an exact, objective metric to measure "high" or "low" volume. It removes subjectivity from your analysis, helping you avoid choppy, sideways markets and lock into major algorithmic expansions.
Optimize your entry precision today by adding this essential volume-filtering tool to your MetaTrader 4 trading toolkit.
2 Downloads
Last Update:
May 19, 2026 02:45 AM
Published:
Jan 19, 2026 20:14 PM
Category: