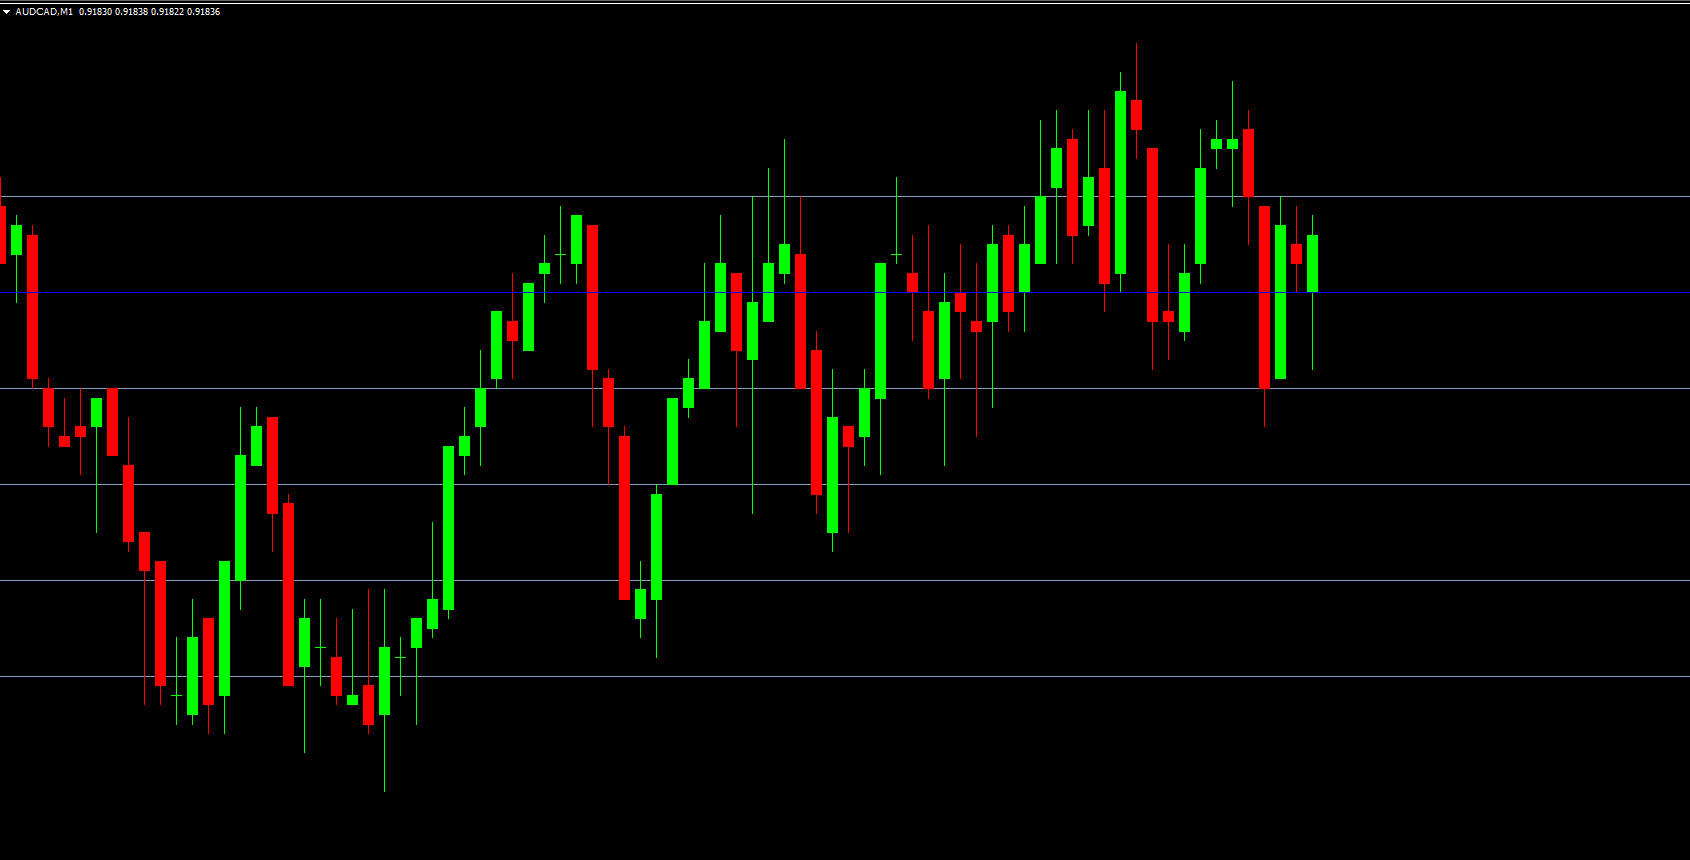
Volume is one of the most overlooked yet powerful elements of technical analysis. Many traders focus solely on price, forgetting that price movements are often driven by changes in trading activity. The Volume Profile Indicator for MT4 solves this issue by visually displaying how much volume is traded at specific price levels. Through the construction of accurate volume profiles, traders gain a deeper understanding of where the market is likely to reverse or accelerate.
If you're a trader who prioritizes volume, this indicator becomes an essential part of your analysis. Its visual representation of volume distribution allows you to quickly identify strong Support And Resistance zones formed by high-volume clusters.
Features of the Volume Profile Indicator
Identification of High and Low Volume Levels
The indicator highlights areas where trading activity is dense (high volume) and levels with minimal trading engagement (low volume). These regions are key for spotting future price reactions.
Volume Point of Control (VPOC) or Point of Control (POC)
A central feature is the Volume Point of Control, the price level with the highest traded volume within a given range. This makes it:
A high-probability reversal area
A strong support or resistance zone
A reference level for future market interactions
Traders rely heavily on VPOC zones because they often mark areas where major market participants entered positions.
Simple Visual Structure
The indicator displays horizontal volume bars directly on the chart. This gives traders a clean, fast, and intuitive way to understand market strength and potential turning points.
How the Indicator Helps Traders
The Volume Profile Indicator for MT4 offers clear entry opportunities based on how price reacts to volume zones. When price reaches the VPOC, it often pauses, reverses, or moves in a controlled manner because this level represents a cluster of previous high-volume transactions.
Recognizing Reversal Zones
When price approaches the VPOC level, traders can look for reversal signals. Because VPOC is tied to strong trading activity from institutional players, these levels tend to be reliable.
Creating Future Support and Resistance
Once identified, VPOC and other high-volume levels often become future support or resistance. Price revisits these zones repeatedly, creating additional entry opportunities for Trend Continuation or reversal trades.
Clear Entry and Exit Points
High-volume areas are not only good for entries—they also serve as effective profit-taking targets. Traders often use:
VPOC as an exit during countertrend moves
High-volume nodes as conservative profit zones
Low-volume nodes as acceleration areas where price moves swiftly
Combining Volume With Market Profile Techniques
Many professional traders combine the volume profile with Time Price Opportunity (TPO) for deeper Market Structure analysis. While TPO shows where price spent time, the volume profile highlights where traders actually placed orders. Together, they offer one of the strongest market profiling combinations available.
For traders who simply want visual clarity, the graphic bars and lines of the MT4 Volume Profile Indicator make it easy to interpret market behavior without advanced charting knowledge.
Conclusion
The Volume Profile Indicator for MT4 is a valuable tool for traders who rely on volume-based analysis. By highlighting VPOC levels, high-volume nodes, and low-volume distribution zones, the indicator assists in identifying high-probability reversal and continuation points. Whether used for support and resistance mapping, entry timing, or profit-target placement, this indicator greatly enhances market clarity.
For more powerful MT4 indicators and trading tools, visit IndicatorForest.com.
FAQ
17 Downloads
Published:
Dec 11, 2025 09:08 AM
Category: