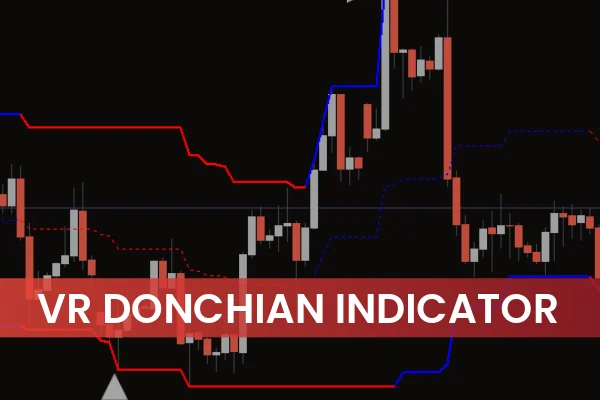
The VR Donchian Indicator MT4 is a powerful trend-following tool designed to help traders identify market direction and potential reversal zones. Based on the traditional Donchian Channel, this indicator plots three bands on the chart — upper, middle, and lower — to visualize price movements within a defined range.
While the classic Donchian Channel relies on simple moving averages, the VR Donchian Indicator enhances it by displaying real-time price levels on each band. This improvement gives traders clearer visual guidance for identifying support and resistance levels, making it easier to decide when to enter or exit trades.
How the VR Donchian Indicator Works
The VR Donchian Indicator calculates the highest high and lowest low over a chosen period and draws three distinct bands on the MT4 chart:
Upper Band – Represents resistance and potential SELL zones.
Middle Band – Serves as a neutral or equilibrium line.
Lower Band – Acts as support and potential BUY zones.
The price moves between these bands, and traders can use this behavior to determine market momentum and entry points. The bands dynamically adjust as new price data appears, helping traders visualize short-term volatility and long-term trend direction simultaneously.
VR Donchian Indicator BUY/SELL Signals
To interpret BUY and SELL signals with the VR Donchian Indicator, observe how the price interacts with the bands:
BUY Signal: When the price touches or dips below the lower band, it suggests the market is oversold. Traders can consider opening a long (BUY) position.
SELL Signal: When the price reaches or surpasses the upper band, it indicates the market is overbought. Traders may open a short (SELL) position.
Neutral Zone: The middle band should be treated as a no-trade zone. When the price is near the middle line, it could move in either direction, so waiting for confirmation is best.
These signals are most effective when used on higher timeframes (such as H4 or Daily), as they reduce false signals caused by short-term noise.
Combining the VR Donchian Indicator with Other Tools
For enhanced accuracy, traders often combine the VR Donchian Indicator with other technical tools, such as:
RSI (Relative Strength Index) – Helps confirm overbought or oversold conditions.
MACD – Identifies momentum changes aligned with Donchian signals.
Moving Averages – Support trend confirmation across multiple timeframes.
By combining these indicators, traders can increase their probability of entering high-quality trades supported by multiple confirmations.
Why Use the VR Donchian Indicator?
The VR Donchian Indicator for MT4 offers several advantages:
Clear visualization of Support And Resistance zones.
Works on all timeframes and market conditions.
Easy to interpret for both beginners and advanced traders.
Free to download and install on MetaTrader 4.
Its simplicity and effectiveness make it an essential addition to any trader’s toolbox. Whether you’re swing trading or Scalping, this indicator can help you stay aligned with the prevailing trend.
Conclusion
The VR Donchian Indicator MT4 simplifies trend analysis by plotting three adaptive bands that serve as entry, exit, and confirmation points. These bands also represent support and resistance levels, making it easier to plan trades based on Price Action.
By mastering this indicator, traders can better anticipate market movements and make informed decisions.
👉 Download the VR Donchian Indicator for free today at IndicatorForest.com and take your trading strategy to the next level!
1 Download
Published:
Nov 02, 2025 13:21 PM
Category: