Unlock Precision Trading with the VTS Setka Indicator for MT4
In the highly competitive world of Forex trading, having a visual edge is often the deciding factor between a successful trade and a missed opportunity. The VTS Setka Indicator has emerged as a premium technical tool designed for the MetaTrader 4 (MT4) platform, offering traders a unique "grid-based" perspective on price action. By visualizing Market Structure through dynamic levels, this indicator helps traders navigate volatility with confidence.
What is the VTS Setka Indicator?
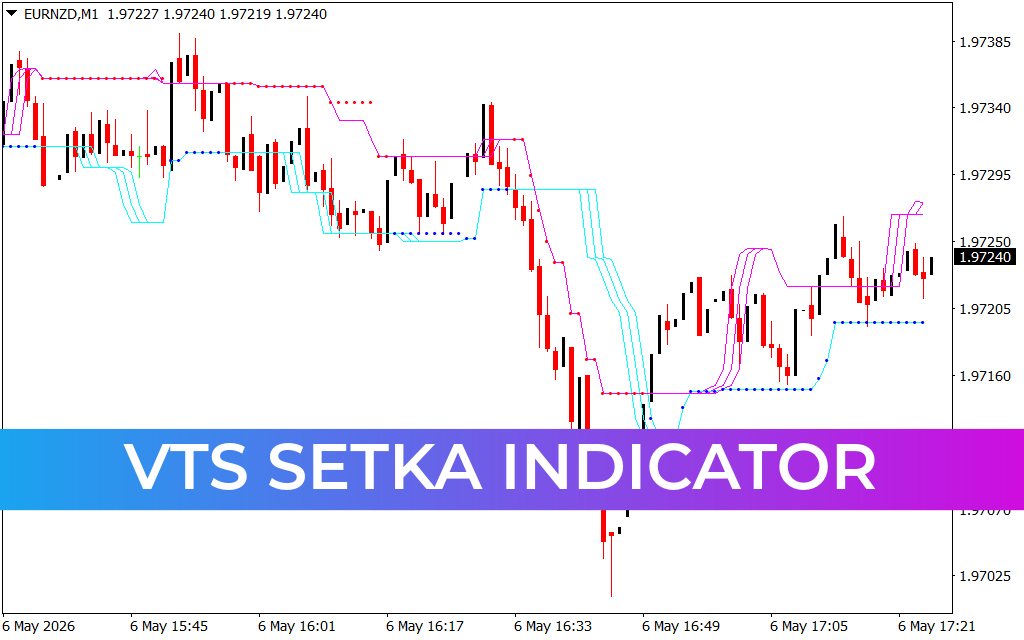
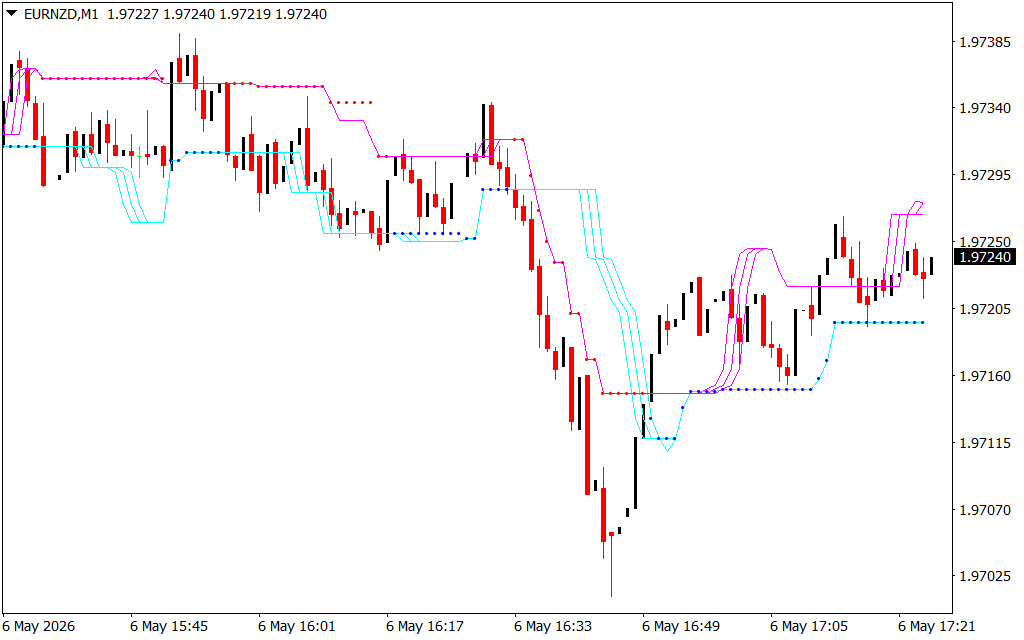
The VTS Setka (Russian for "Grid") Indicator is a sophisticated charting tool that plots support, resistance, and channel levels based on historical price mathematical averages. Unlike standard indicators that can lag significantly, VTS Setka focuses on current market geometry. As seen in the provided chart EURNZDM1.png, the indicator creates a visual framework of steps and channels (the cyan and magenta lines) that help define the trend's boundaries.
Key Features of VTS Setka
- Dynamic Channel Mapping: The indicator automatically adjusts its levels based on market volatility. This allows traders to see exactly where the "fair value" of a currency pair lies and where price is overextended.
- Trend Reversal Identification: By observing how price interacts with the upper (magenta) and lower (blue/cyan) boundaries in EURNZDM1.png, traders can spot potential exhaustion points before they happen.
- Multi-Timeframe Versatility: While highly effective on M1 charts for scalpers, the VTS Setka is robust enough to provide structural clarity on H1 and D1 timeframes for swing traders.
- Clean Visual Execution: It replaces cluttered charts with a logical grid system, reducing the mental fatigue associated with complex technical analysis.
Trading Strategy: How to Use VTS Setka
To maximize the potential of the VTS Setka Indicator, traders should look for "break and retest" patterns. In the EURNZDM1.png example, when price breaks through a magenta level and the indicator shifts its "steps" downward, it confirms a bearish momentum shift. Conversely, when the price stabilizes above the blue dotted levels, it provides a high-probability zone for long entries.
Many professional traders use the VTS Setka as a primary filter. If the price is trading in the middle of the "Setka" grid, it indicates a neutral market where it is best to stay sidelined. Trading at the extremes—the edges of the grid—is where the most profitable risk-to-reward ratios are found.
Conclusion
The VTS Setka Indicator is more than just a trend line tool; it is a comprehensive market mapping system. By providing a clear visual representation of price levels, it empowers traders to make data-driven decisions rather than emotional ones. Whether you are Scalping the M1 timeframe or managing long-term positions, VTS Setka provides the structural clarity needed to succeed in today’s markets.
5 Downloads
Last Update:
May 06, 2026 20:27 PM
Published:
Jan 27, 2026 01:54 AM
Category: