Master Institutional Levels with the Waddah Attar Pivot Indicator
In the world of professional Forex trading, success isn't found in chasing price—it's found in anticipating where the big money will react. Institutional traders, banks, and hedge funds rarely look at lagging oscillators; instead, they focus on mathematical "pivot points" derived from historical price data. The Waddah Attar Pivot indicator for MetaTrader is a high-performance technical tool designed to automate this process, providing you with a clear roadmap of the market’s psychological floor and ceiling.
The Logic of Waddah Attar Pivot
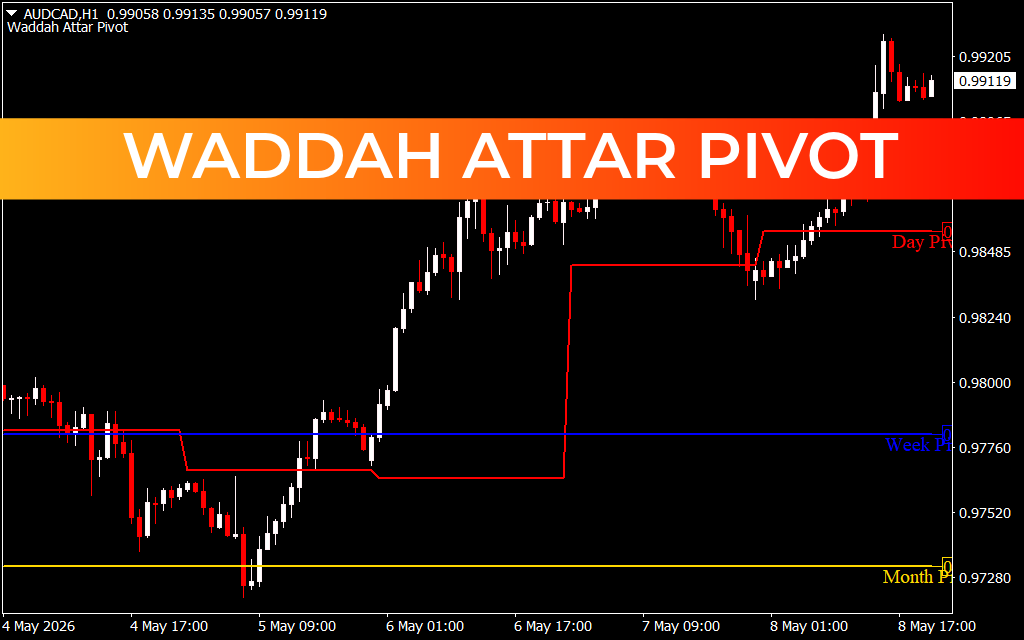
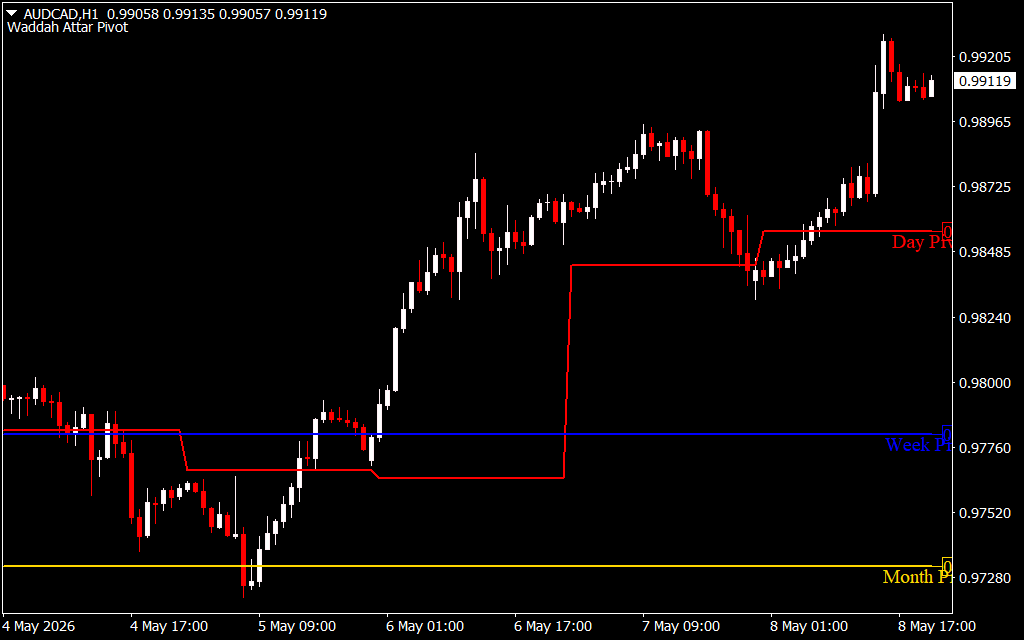
Unlike standard pivot indicators that can clutter your chart with dozens of irrelevant lines, the Waddah Attar version is engineered for clarity and multi-timeframe perspective. As seen on the H1 timeframe, the indicator plots three critical levels: the Day Pivot (red), the Week Pivot (blue), and the Month Pivot (yellow).
These levels represent the "equilibrium" price for their respective timeframes. When price is trading above these lines, the market sentiment is considered bullish; when below, the sentiment is bearish. Because these levels are calculated using the previous period's high, low, and close, they act as self-fulfilling prophecies where significant buying or selling pressure often emerges.
Key Features and Strategic Advantages
- Multi-Timeframe Integration: By displaying daily, weekly, and monthly pivots on a single chart, Waddah Attar Pivot allows you to identify "confluence zones." If the Day Pivot aligns closely with the Week Pivot, that level becomes an incredibly powerful area for a potential reversal or breakout.
- Objective Support And Resistance: These aren't subjective trendlines that vary from trader to trader. These are mathematical certainties used by the entire trading community, making them highly reliable zones for placing stop-losses and take-profit targets.
- Automated Level Shifting: The indicator features a "stepped" visual logic. As the market transitions into a new day or week, the indicator automatically recalculates and shifts the lines, ensuring your chart always reflects the most current institutional data.
- Superior Visual Hierarchy: The color-coded system (Red/Blue/Yellow) allows for instant recognition of market bias. You can determine the long-term, medium-term, and short-term trends in a split second without switching timeframes.
- Zero Lag Performance: Because pivots are leading indicators (calculated before the new period begins), they provide a massive advantage over moving averages by showing you where price is likely to go before it gets there.
Trading with Waddah Attar Pivot
The most effective way to use this indicator is as a break-and-retest tool. For example, if the price aggressively breaks above the Month Pivot (yellow line) and then returns to "test" it as support, this provides a high-probability entry for a long position.
Additionally, intraday scalpers often use the Day Pivot (red line) as a magnet. If the price opens far away from the pivot, there is a high statistical probability that it will "revert to the mean" and touch the pivot line at some point during the session.
Conclusion
The Waddah Attar Pivot indicator is more than just a drawing tool; it is a lens into the mechanical structure of the market. By grounding your trading in daily, weekly, and monthly mathematical pivots, you move away from guesswork and toward a data-driven strategy used by the pros. Simplify your analysis and start trading with the strength of institutional levels by adding Waddah Attar Pivot to your MetaTrader platform today.
2 Downloads
Last Update:
May 09, 2026 21:09 PM
Published:
Jan 24, 2026 22:54 PM
Category: