Master Institutional Pivot Levels with Waddah Attar Weekly Fibo
In the high-stakes environment of forex trading, identifying structural Support And Resistance levels is critical to sustaining a mathematical edge. While standard daily pivots provide short-term targets, macro-driven market makers and institutional desks focus heavily on higher-timeframe boundaries to deploy large blocks of liquidity. The Waddah Attar Weekly Fibo indicator for MetaTrader is engineered to automate this macro mapping, plotting critical weekly Fibonacci retracement levels directly onto lower timeframe charts to reveal clear institutional price magnets.
Decoding the Weekly Fibonacci Framework
The Waddah Attar Weekly Fibo indicator calculates structural market extremes based on the prior week’s high, low, and close parameters. By applying classic Fibonacci ratios to this multi-day anchor, the algorithm projects an automated roadmap across the current week's trading sessions, eliminating the human error and subjectivity associated with manual drawing.
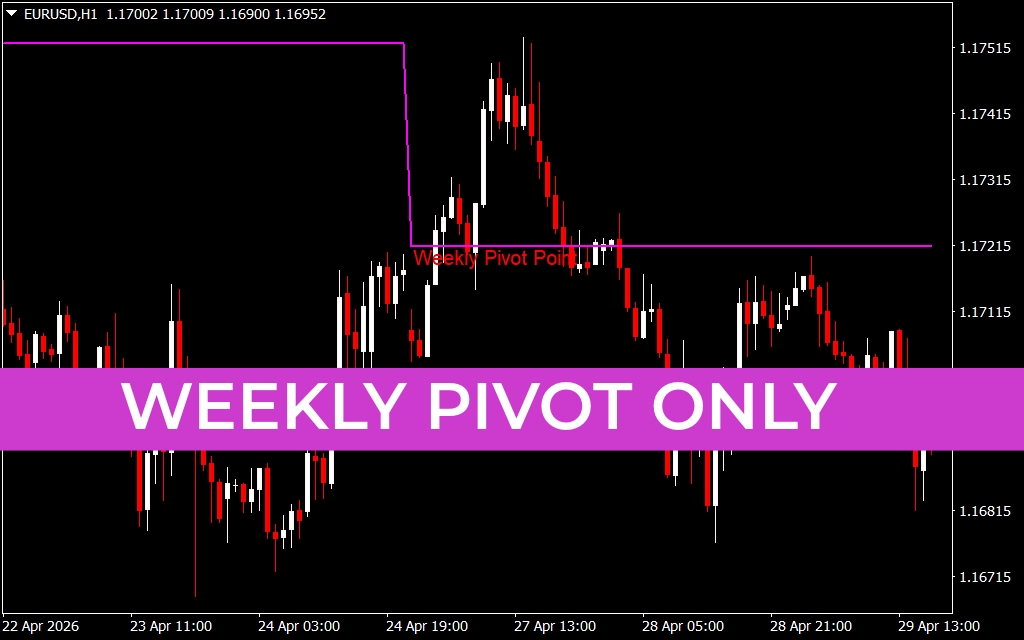
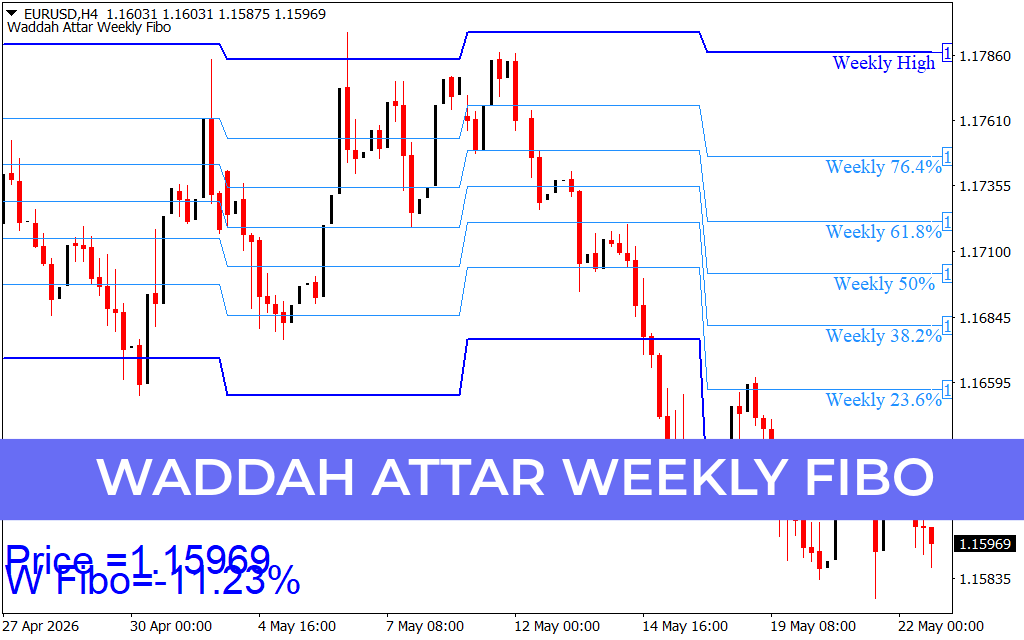
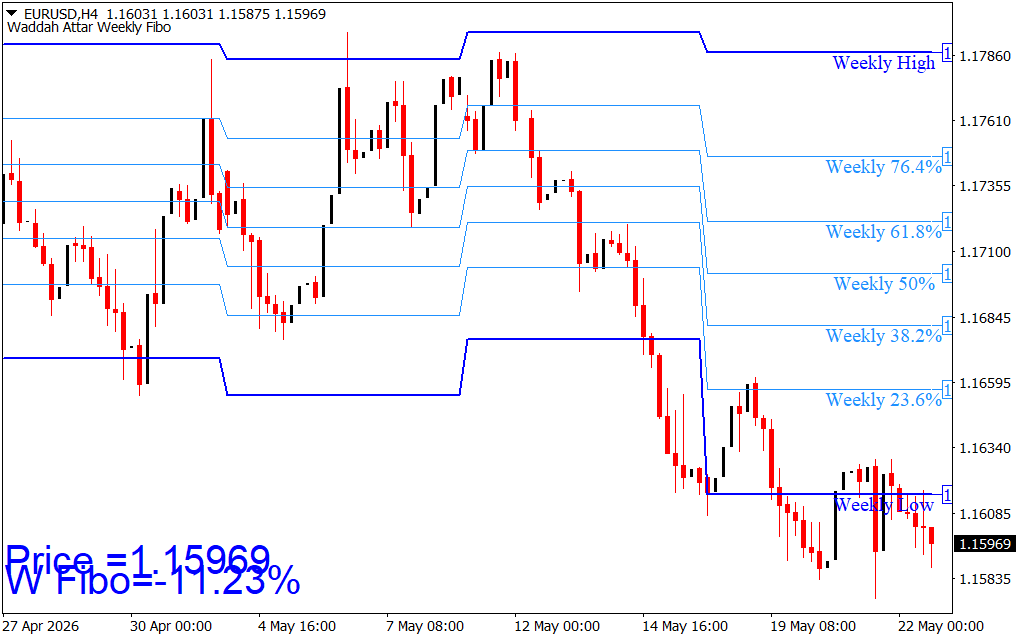
As displayed on the EURUSD H4 chart, the workspace is organized into precise structural zones:
- Weekly High and Weekly Low: Indicated by the thick, solid blue outer boundaries, these levels represent the ultimate macro support and resistance ceilings for the current weekly cycle.
- Fibonacci Retracement Channels: The indicator plots precise horizontal expansion lines corresponding to institutional golden ratios: Weekly 23.6%, 38.2%, 50%, 61.8%, and 76.4%.
- Live Price Tracking Metrics: To aid real-time execution, a bold visual readout is anchored in the bottom-left corner of the chart (e.g.,
Price = 1.15969,W Fibo = -11.23%), telling traders exactly where the current asset value sits relative to the overall weekly range.
Key Technical Advantages and Features
- Automated Macro Mapping: Removes guesswork by instantly refreshing structural levels at the start of every trading week.
- Institutional Level Confluence: Fibonacci steps serve as reliable zones where market orders group, providing high-probability areas for bounces or structural breakouts.
- Streamlined Data Display: Text metrics give traders an instantaneous mathematical summary of asset positioning without forcing them to manually measure distances.
- Multi-Timeframe Integration: Highly effective on H4 charts for swing traders, yet easily scales down to M15 charts to guide intraday breakout strategies.
Strategic Trade Execution Using Weekly Fibo
To extract maximum value from the Waddah Attar Weekly Fibo system, utilize these levels as key operational zones within your trading plan:
- The Golden Ratio Rejection: Watch for price to pull back to major structural channels like the Weekly 61.8% or 50% levels. A clear candlestick rejection pattern at these lines indicates that institutional orders are defending the area, opening the door for a high-probability reversal entry.
- The Macro Target Breakdown: When a trend breaks out beyond a Fibonacci line, the next level serves as your natural algorithmic target. For instance, as price breaks cleanly below the Weekly 23.6% line, momentum naturally carries the asset down toward the major Weekly Low barrier near 1.16085.
- Calibrated Stop Placement: Protect your capital by placing structural stop-losses just beyond the nearest opposing Fibonacci level. This guarantees that your risk boundaries are safely backed by real-world institutional order flows rather than arbitrary pip counts.
3 Downloads
Last Update:
May 22, 2026 19:56 PM
Published:
Jan 17, 2026 16:40 PM
Category: