Master Macro Horizons: XardG AWR W1 Indicator for MetaTrader 4
Navigating lower timeframes without an understanding of macro market structure is one of the most common pitfalls for retail day traders. On a 1-minute (M1) or 5-minute (M5) chart, short-term volatility can easily blind you to major institutional Supply And Demand zones. The XardG AWR W1 Indicator solves this systemic issue by mathematically projecting high-level weekly boundaries, average weekly ranges (AWR), and critical structural pivots directly onto your lower-timeframe workspace.
Mapping the Core Architecture of Weekly Key Zones
The foundational philosophy behind the XardG AWR W1 indicator is rooted in the concept of institutional order flow. Large financial entities, such as central banks and market-making algorithms, do not view the market through fragmented sub-hour candles. Instead, they operate on weekly horizons, targeting major liquidity pools, key psychological levels, and structural balance points.
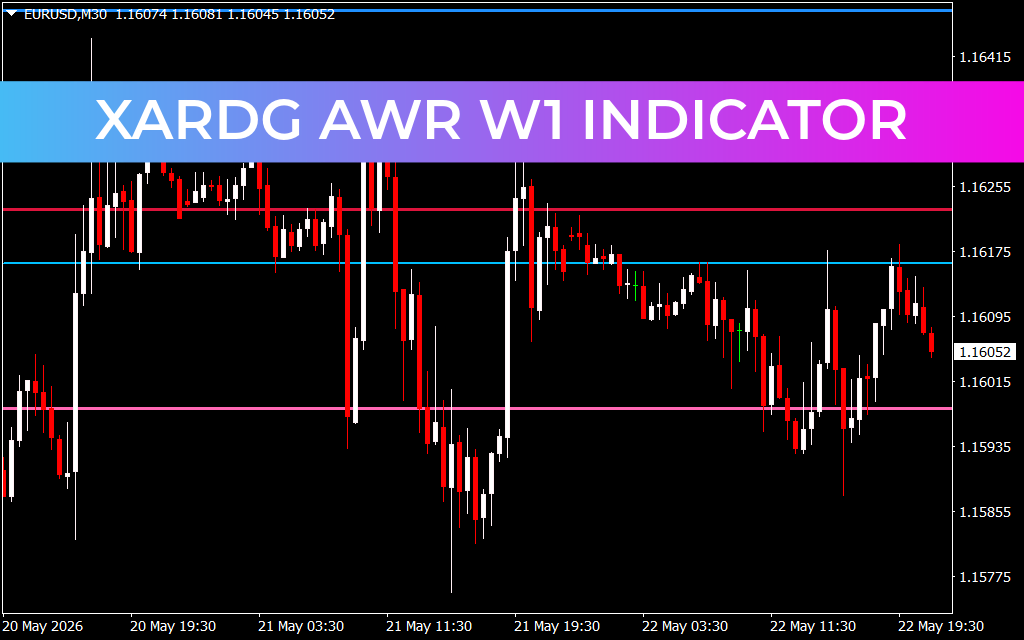
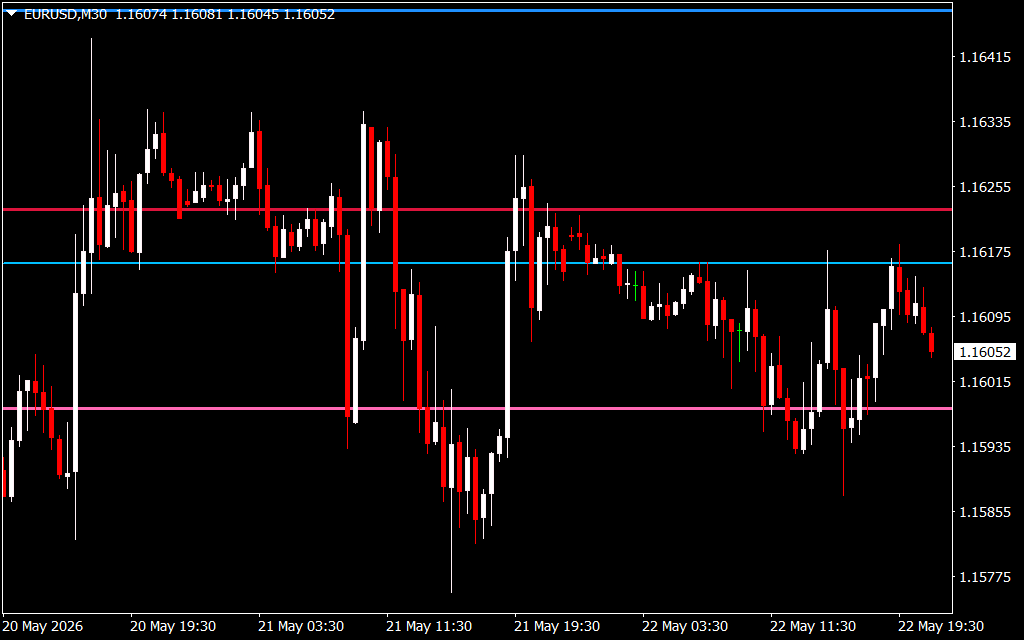
When loaded onto a multi-timeframe asset workspace like the EUR/USD, the tool projects a clear, color-coded horizontal line matrix that strips away standard technical clutter:
- Major Macro Resistance: Highlighted by top-tier horizontal boundaries (such as the upper pink lines), these zones mark significant historical distribution pools where buying momentum frequently exhausts itself.
- Central Equilibrium Line: Represented by a distinct cyan horizontal anchor, this line calculates the mid-point or fair value zone of the broader weekly Market Structure.
- Major Macro Support: Drawn as a lower floor matrix, these zones highlight critical weekly accumulation blocks where institutional buyers step in to defend physical pricing structures.
By seeing these high-level macro zones in real time, short-term scalpers can instantly determine whether they are buying into major structural overhead resistance or selling directly into an ironclad liquidity floor.
Strategic Scalping with Multi-Timeframe Confluence
During live London and New York trading sessions, Price Action frequently undergoes sharp, algorithmic expansion runs. If you are tracking a sharp downward trend on an M5 or M30 chart, it can be incredibly tempting to chase the momentum short. However, if the XardG AWR W1 indicator shows that price is simultaneously colliding with a major weekly support boundary, the short expansion leg is highly likely to reverse violently.
Systematic market participants can utilize this structural overlay to implement two primary strategies:
- Macro-to-Micro Reversals: When price drives deep into a weekly W1 resistance or support band, drill down into your M1 or M5 execution chart. Wait for a candlestick validation pattern (like an engulfing bar or structural shift) to confirm institutional rejection before placing a high-probability counter-trend position.
- Targeting with AWR Metrics: Instead of relying on arbitrary profit-taking targets, use the dynamic horizontal levels as your absolute exit points. Buying near a structural lower band and taking profit directly at the central cyan equilibrium line ensures a highly disciplined, rule-based approach to risk management.
Key Features for Professional Chart Configuration
- Automated Weekly Range Calculation: Instantly updates macro support, resistance, and median lines on your chart workspace at the start of every trading week.
- Multi-Timeframe Compatibility: Seamlessly displays high-level structural parameters across all chart timeframes, from M1 Scalping screens up to H4 swing charts.
- Clean Visual Layout: Replaces confusing mathematical oscillator windows with a highly elegant on-chart line matrix that leaves your main price action completely legible.
The XardG AWR W1 Indicator acts as your definitive directional map, anchoring your short-term execution strategies to real, undeniable institutional key levels to maximize your overall trading discipline.
1 Download
Last Update:
May 23, 2026 01:51 AM
Published:
Jan 17, 2026 12:11 PM
Category: